
Improving your processes by implementing lean tools is always a nice idea, but in the end it should also benefit the company. This article describes a few financial measures and ratio´s, and the link between lean improvements and these measures.
The goal of this article is for the reader to gain understanding of this link between lean and financial results, so that future improvements (or kaizen events) can be planned based on today´s financial statements of the organization. These improvements can then be used as input for the strategic alignment process (x-matrix during the hoshin catch-ball process).
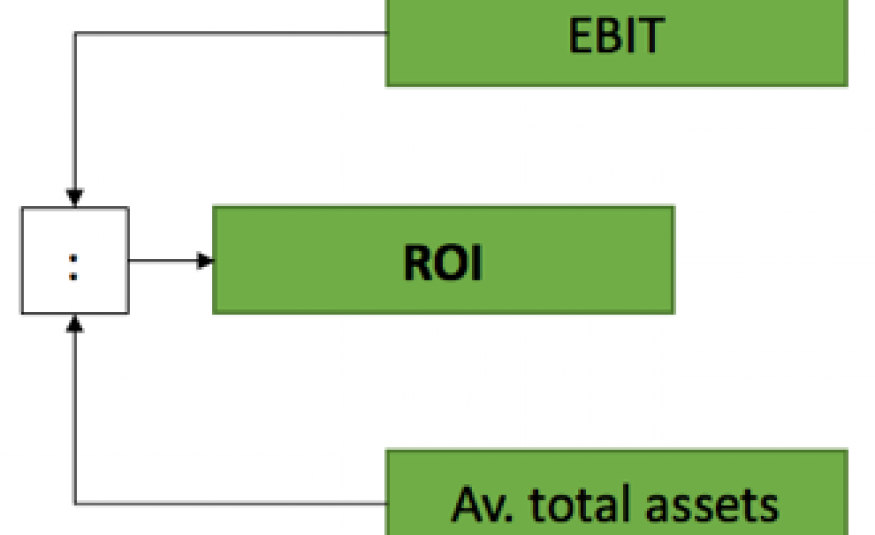
One financial measure for organizations is the RETURN ON CAPITAL EMPLOYED (ROCE), which is the ration between Earnings Before Interest and Tax (EBIT) and average working capital (see illustration 1) that was needed to generate those returns. Improving the ROCE can be done by either increasing earnings (EBIT part), reducing the total assets necessary to generate those earnings, or both. Fortunately, with lean, you can do both, simultaneously.
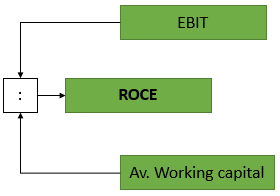
Figure 1: ROCE is calculated by dividing the EBIT by the average total assets
The AVERAGE WOKRING CAPITAL, is the sum of average fixed assets and average current assets, minus the current liabilities (see illustration 2). All are mentioned in the balance sheet (figure 4). Average means, that we do not take the current value which is mentioned in the balanced sheet, but the average between the opening and the closing value of that period.
In this case, we are interested in the current assets value, because this is where we find the different inventories that are influenced by the way we organize our processes (see illustration 2).
By shortening the lead time of a process (after using value stream mapping), the inventory levels within the process decrease. These can include raw material inventories (for instance by using supplier kanban or because we balanced the load with heijunka), inventories in the line (because we created one piece flow) as well as finished goods inventory. This means, that reducing lead time does not only make a company more flexible in serving your customers, the company also need less capital to finance the operation.
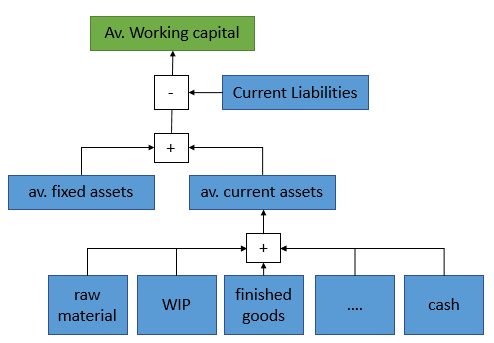
Figure 2: Current assets breakdown, in relation to average working capital
Reducing inventory levels within a process not only has an impact on the current assets category in the balance sheet, it also influences the costs necessary to be able to generate your earnings, which is measured in the EARNINGS BEFIRE INTEREST AND TAX (EBIT).
Holding up inventory in your processes costs money: physical space costs, management costs, insurance costs, and possibly obsolescence costs. Depending on the product, these costs together could sum up 18-35% on a yearly basis (Dominick & Lunney, 2012).
All of these costs are found on the profit and loss statement. There are two types of cost that influence the EBIT: direct and indirect costs. Illustration 3 shows how both the type of costs impact the EBIT.
Direct costs are costs that can be linked to orders directly. Within the Inventory holding costs, these could include material costs and costs of redundancies or damage.
Indirect costs are costs that cannot be linked to orders directly and are made whether there is an order or not. Within the inventory holding costs, these could include depreciation costs, physical space costs, transport costs, management costs and insurance costs.
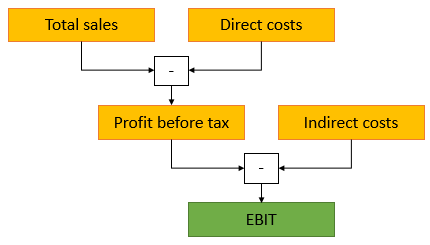
Figure 3: impact direct and indirect costs on EBIT
Next to the ROCE, LIQUIDITY of an organization is an important measure of organizational health. Having cash available in an organization for daily business is like blood in the human body, you need it to stay alive. Bills need to be paid and investments need to be done to increase the performance of the organization.
This is where the CASH FLOW STATEMENT comes in. In this statement, the organization summarizes the changes in the use of capital in the balance sheet. One example of a balance sheet is shown in figure 4 below. A part of the measures within the balance sheet, the current assets, are already shown in figure 2 above. Within the year, the organization can move assets around in the balance sheet, for instance:
- Cash can be freed up within the current assets part, by reducing inventories
- Cash can be freed up by selling fixed assets, like buildings or machines
- Cash can be freed up because bills are paid by customers (accounts receivable)
- Cash is moved from current assets to fixed assets, due to investments which improve future performance
- Cash is used to pay debt, and therefore both total assets as well as the total liabilities side reduces
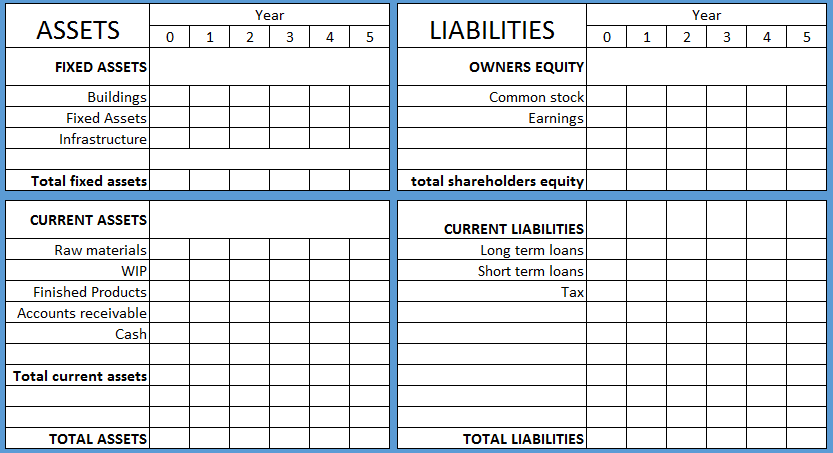
Figure 4: Balance sheet example
So, why is this important? Organizations, especially the public owned ones, are rated using multiple FINANCIAL RATIO´S. Here are three examples or ratio´s that say something about the financial health of an organization and how we can influence them with lean.
Liquidity ratio = (other liabilities – cash) / cash flow
The higher the cash flow, the less time we need to pay back our long term liabilities and therefore the healthier our organization is. Freeing up cash due to lead time reduction helps on both the cash side as well as the cash flow side.
Return on capital = (EBIT / total liabilities) x 100
The higher the EBIT, the better the ratio. When processes are improved and productivity rises and inventories are reduced: the EBIT increases in the long term and so does the return on capital, because you are reducing both direct and indirect costs. In the short term however, the EBIT will decrease, because inventory has traditionally mentioned in the books as raw material costs plus the value that is added to the product in the process so far. This means a product for which the raw material costs are €10, can be mentioned on the balanced sheet with a value of €12.
When freed up cash is used to pay off loans, the total liabilities decrease, which also improves the ratio. Benchmark companies have a return on capital rate of >15%.
Cash flow margin ratio = (cash flow / total sales) x 100
This is a percentage that tells us how much earnings were necessary to create a certain amount of cash, to be able to compare the organization with others. Benchmark companies have a cash flow margin ratio of >10%.
As with all KPI´s, the goal of the financial KPI´s and ratio´s is to DEFINE ACTION. What KPI would we like to improve in our company and what is the breakdown of this KPI? From the explanation above it becomes clear that reducing costs helps improve all financial KPI´s. The question is, where and how do you reduce those costs?
First, we should analyze our Profit & Loss statement to analyze where the costs of the organization originate from (see figure 5).
Then, we can target what processes are in need of improvement, for which we can use lean tools such as value stream mapping to improve flow and increase productivity.
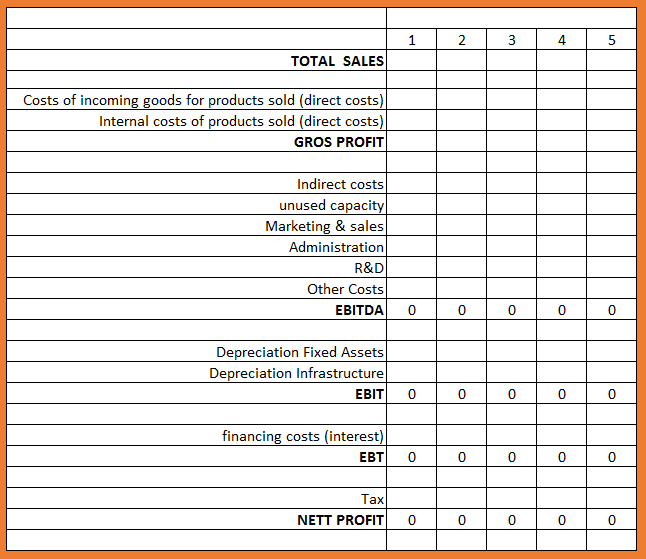
Figure 5: example Profit Loss Statement
Using lean methods to improve the efficiencies of your processes can help the organization safe some cost. If you want to be sure your lean initiatives help you increase great financial results: you have to select the processes to improve based on your financial reports.
Continue to:
The gate of purpose - Hoshin Kanri
REFERENCE:
Dominick, C., & Lunney, S. L. (2012). The Procurement Game Plan – Winning Strategies and Techniques for Supply Management Professionals. Ford Lauderdale: J.Ross Publishing.