
In Six Sigma DMAIC, 8 Simple Steps for Successful Green Belt Projects, myself and co-author Dietmar Stemann describe how to lead a Green Belt project using a variety of Six Sigma tools. Instead of simply listing tools like moth Six Sigma books do, this book takes you through the project step by step and helps you select the right tools. and best of all: it is written in plain language so you do not feel like you are back in school.
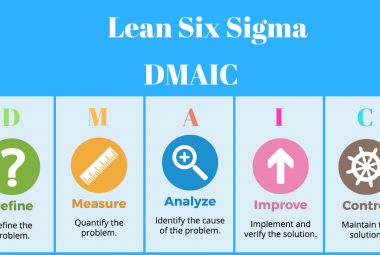
In this book, the 5 phases of DMAIC are split into 8 steps, to help explain what the purpose of the phases and the tools are that you can use within a Green Belt project. Each chapter of the book contains one of the steps, and the tools that can be used within that step. Figure 1 provides an overview of the DMAIC phases along with the associated 8 steps. For each step, we also suggest appropriate tools.
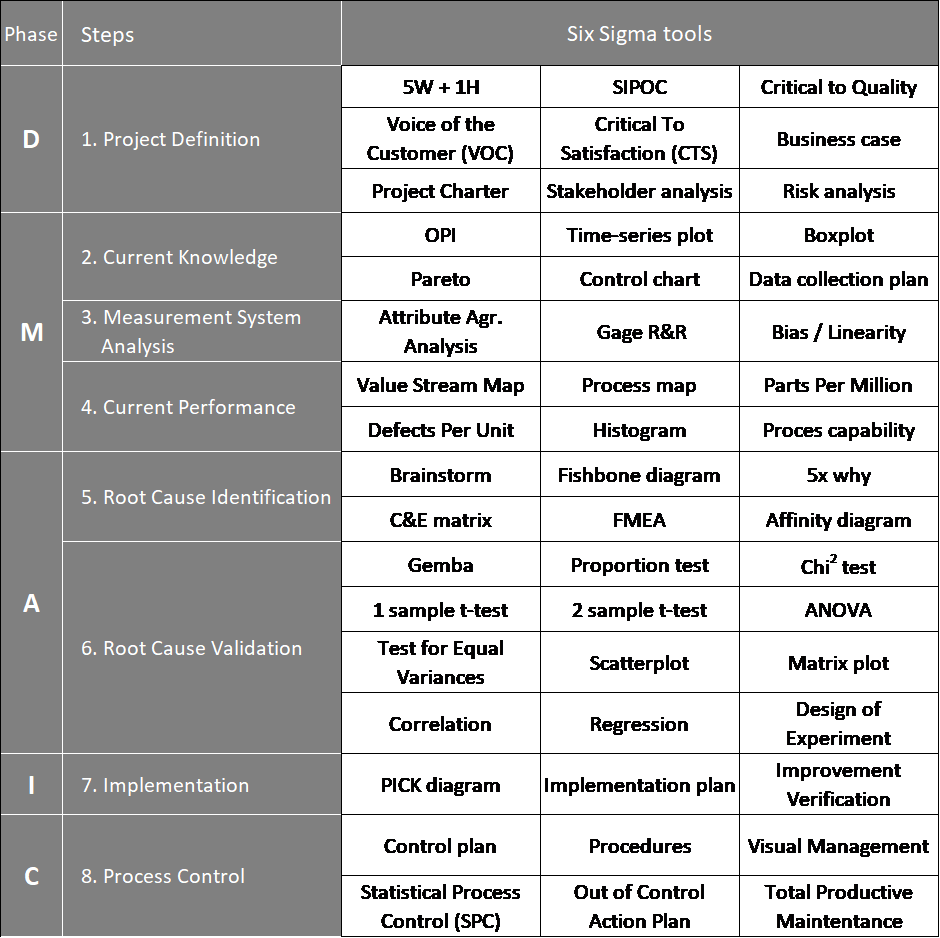
Figure 1: Overview of frequently used tools within a Green Belt project (Source: Panneman & Stemann, 2021)
As the Six Sigma project levels build upon each other, this book about Six Sigma Green Belt projects also describes tools you would find in a Yellow Belt project. In such a case, this will be indicated in the following chapters when describing the tool.
First, let's look at the 8 steps of a Green Belt project, which reside within the DMAIC phases:
Step 1: Define – Project definition
The first step in a Green Belt project includes the complete define phase. The project team must work out the project definition in this step. A summary of this definition is usually documented in a project charter. A project charter outlines the scope and objectives of the project, among other things. Useful tools that can be used for this step are the 5W + 1H, SIPOC, the Voice of the Customer (VOC), the Critical to Quality analysis (CTQ) as well as Critical to Satisfaction analysis (CTS). We also define our project KPI, the project Y, in this phase.
In this book, we will use a mathematical approach where Y is a function of x’s and where Y is the project Y that we would like to improve. The x-variables are input variables of this function that lead to that Y value.
In addition, the project definition step includes a business case to summarize how important it is to carry out the project. It can also contain a stakeholder analysis to indicate who can benefit from the project and/or influence its success and a risk analysis to identify risks that could undermine the project's success.
Step 2: Measure – Current Knowledge
We are now in the Measure phase, which is divided into steps 2, 3, and 4 as you can see in figure 1 above. Step 2 describes the mapping of current knowledge. Chapter 4 describes several options for understanding the problem from data that is already available: time-series plot, Pareto diagrams, box plots, and control charts are all examples of graphical tools that can help the project team to visualize the project focus. The project team also makes an Output-Process-Input diagram (OPI) diagram here, to map the current x-variables that will be relevant for the project. If no data is available yet, you need a data collection plan, which is also described in chapter 4.
Step 3: Measure – Measurement System Analysis (MSA)
In the third step of the project (and the second step of the measurement phase), the data quality is tested by looking at the measurement systems used to collect the data. For this, we use tests for linearity and bias for MSA type 1 and depending on the type of data we may use the Attribute Agreement Analysis or the Gage R&R for MSA type 2. They are described in detail in Chapter 5. The results of these tools help the team to ensure that the data used in the project is reliable.
Step 4: Measure – Current Performance
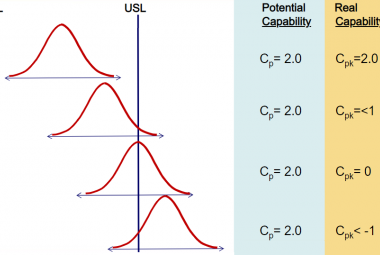
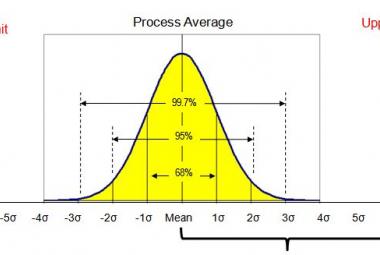
Chapter 6 describes the fourth step of a Green Belt project (the third step of the measurement phase), in which we analyze the current performance of the process. There are several methods to describe performance. First, we describe two mapping tools: process mapping and value stream mapping. Then, the statistical terms parts per million and defects per unit are discussed. After that, we look at the most well-known performance metrics Cp & Pp (for stability) and Cpk & Ppk (for capability), the so-called capability indices. The histogram is also explained in this chapter to enhance the understanding of these tools.
Step 5: Analysis - Root Cause Identification
We are now, at step 5, in the analysis phase of our DMAIC project. In this step, described in Chapter 7, we generate potential causes for the problem we identified in the previous 3 steps and that we want to. We use brainstorming, a fishbone diagram, and a cause and effect matrix for this. At the end of this step, we get a first impression of different inputs (x's) that may influence the output (Y) of the process (P).
Step 6: Analysis - Root Cause Validation
Step 6 describes how to validate the causes identified in Step 5. The correlation and matrix plot are visual tools you can apply in this step. Statistical tests discussed in this step (and in Chapter 8) are: proportion test, Chi2 test, t-tests, as well as ANOVA, Regression, and Design of Experiments. You will see that the type of test you use to validate a cause depends on the type of data you have collected. You will therefore never use all these tools in your project, but usually at least one.
Step 7: Improve - Implementation
Step 7 describes the entire improvement phase, where we identify, implement and check whether the countermeasures have helped us achieve our project objectives. This step is described in Chapter 9.
Step 8: Control - Process Control
Our last step, step 8 is about establishing and standardizing the new way of working so that this project’s problem will not reoccur in the future. Chapter 10 describes this step within the project, and we use Statistical Process Control, among other things, to keep measuring key project metrics to ensure that the problem does not reoccur. Furthermore, this chapter describes a few visual management tools and provides a glimpse at the link between Six Sigma and Total Productive Maintenance.
After extensively discussing the 8 steps of a DMAIC project, Chapter 11 provides a guide for managing, coaching, and documenting projects.
Six Sigma DMAIC is a must have for every Six Sigma Green Belt. After learning how to use each tool in class room training, this book can help you to recap what the differences are between all these statistical tools, and which one to select for your current project.
Continue to:
Introduction to six Sigma - What is Standard Deviation?
SOURCE:
Panneman, T., Stemann, D., 2021, Six Sigma DMAIC - 8 Simple Steps for Successful Green Belt Projects, Dublin: MudaMasters (order this book)