Heijunka is a Japanese Tool, which is used to balance production. When a workstation or production line produces multiple products with different process times, variation (or Mura) in the process emerges. This variation in the amount of work can be reduced when the different products of the mix are balanced in the available time.
This Lean principle goes against a lot of traditional ways of thinking, because the balancing exercise leads to more change overs which are on its own not value adding. This article will explain why it can be useful to choose to balance anyway, and two examples of how to visualize the production interval: the Production Wheel and the Heijunka Box.
There are at least five elements of HEIJUNKA: the interval in which all products will be produced (1) a fixed sequence of products (2), a predetermined inventory policy (3), variable number of items for each product (4) and the direction for improvement (5).
The first outcome of the Heijunka will be a fixed interval in which the product family can be produced. When comparing total demand and change over times, one can calculate how many production cycles can be made while delivering all customers. This can be done using the Yamazumi.
The fixed sequence of products in that certain interval reduces the number of different change-overs that need to be made in every product cycle. When product types 1, 2 and 3 are always produced in the same order, a change over from 3 to 2, or 2 to 1 will not me needed anymore. This way the variation of Change over times is reduced. When change-over times vary between products, try to create a sequence which eliminates the longest change-over times, in which case the amount of waste (muda) necessary to produce each product is reduced as well.
The fixed sequence facilitates the defining of the inventory policies of raw materials. When it is defined what the interval is in which the workstation will be producing, the size of inventory buffers can be calculated (see: supermarket and FIFO).
Within the fixed interval and the fixed sequence, the number of products per type may still vary. This leaves room to react on variations in customer demand. The speed of reacting to the changes fully depends on the length of the interval. The shorter the interval, the faster one can react and the smaller the impact on the work content will be.
Finally, the Heijunka shows the direction for the next improvement. The goal of every Lean Tool is to help you find the next area of improvement (Floyd (2010) and Rother (2010)). The exercise of defining a fixed sequence of products or reducing the interval could bring up issues that need resolving. Complexity and Variation are both themes that lead to waste (muda) and are therefore worth examining.
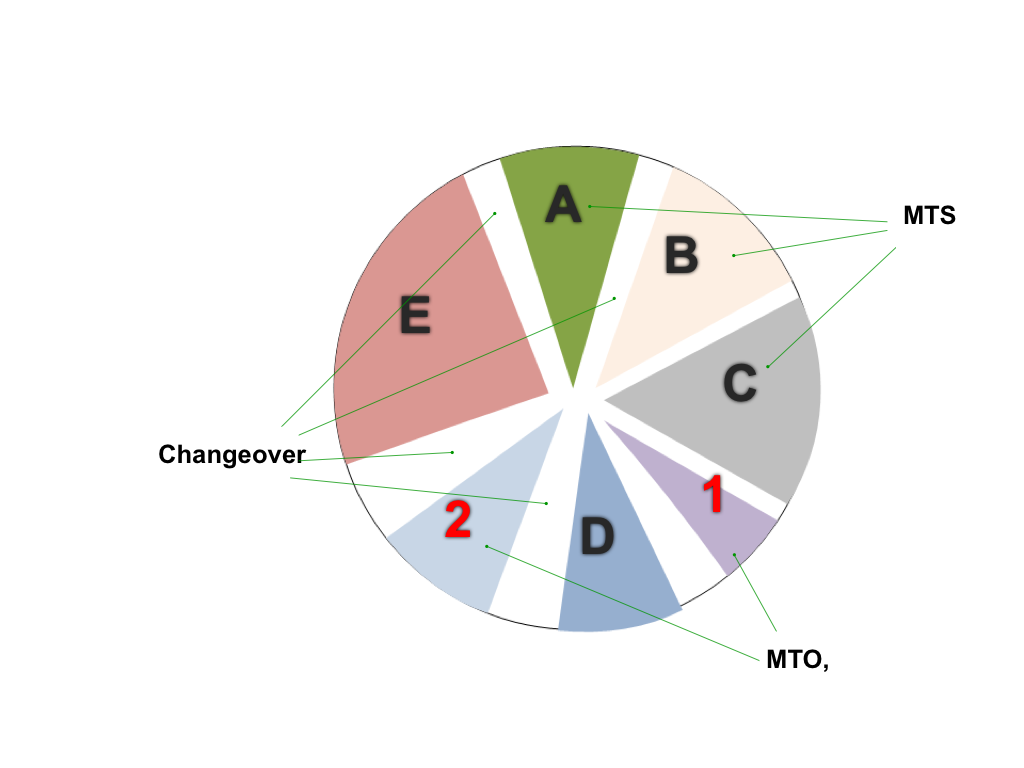
Illustration 1: Example of a Production wheel (source)
THE PRODUCTION WHEEL is the way to visualize the production interval and the production sequence within the interval (see illustration 1 above).
King (2009) writes that the production wheel can contain both made-to-order as well as made-to-stock products. As written above, the sequence of products is fixed and the number of items per product may vary.
When designing the wheel, the most important decision is the speed in which the wheel turns, because it represents, as stated above, the interval in which every product is produced. This is called the EPIE (Every Product Every Interval). The shorter the interval is, the faster supermarkets can be replenished and thus the smaller supermarkets need to be (Rother & Shook, 1999).
More important: the interval determines the total lead time, batch sizes, inventory levels and number of products which is possibly affected when an error occurs.
For example, when all products are produced once a week, the downstream workstation(s) need to buffer each product for at least a week of customer demand, which equals one week of Lead time. Producing every product once a week also means that batches need to be big enough to fulfil the entire weekly demand in one batch, which increases the Waiting-Time-To-Batch for each product, hence, even more lead time. Finally, when a defect is found at the downstream workstation, the entire batch could be contaminated and need to be checked.
So what happens when the Interval is one day? The downstream inventories need to keep one day of inventory for each part, the lead time will therefore only be increased with one day for those inventories, the waiting time to batch will be smaller because the demand will be split over more batches, and the possible amount of contaminated product is also maximum one day.
In the end, the choice of the EPEI will be the shortest possible interval time based on Flow optimization and resource optimization, the Economic order quantity.
The shortest possible interval is the time where all planned cycle time is planned as close to Takt as possible and therefore the time that is closely planned towards one-piece-flow as possible. The interval is calculated as follows: sum up the process times for all products in the family for the specific workstation for a certain interval, for instance a week. Take the total production time available in the week, and subtract the total process time. The result is the time which is left for changeovers. With the fixed sequence, one can also calculate the total time needed for all change overs for one complete interval. The shortest possible interval is the time available for changeovers divided by the total change over time.

Illustration 2: Heijunkabox (source)
For discrete production, for instance assembling cars paper clips or mobile phones, THE HEIJUNKA BOX can be used as a tool to combine the balancing principle with a visual system for the Pitch. The pitch system visualizes whether or not production is still on track or not (Rother & Shook, 1999). Intervals can be defined to be anything between 5 minutes to 2 hours. Process in which the process times or batches are so big that the cycle times exceed the 2 hours, like in the process industry, using a Heijunka box is less value adding.
Illustration 2 (above) shows an example of a Heijunka box. In its simplest form, this box is a wooden or plastic box with different square slots in which work orders can be planned using (Kanban) cards. In this example, the production cycle is defined to be 60 minutes.
The box contains 2 dimensions: product types (vertically) and time (horizontally). The different types of products are planned in their fixed sequence from the top down. This example also shows that the amount of work can vary per product. In this one hour interval, products A and B are produced 3 times each, C is produced twice and D only once.
By visualizing the production planning in the time axis, it is not only visible what needs to be produced on a certain day, but automatically shows you when there is a problem at any given time during that day. A problem can delay production, which may result in the operator fetching his next order a bit later than planned. This means that the card will still be in the box at the moment it was supposed to be taken out.
The Heijunka box also leaves room for flexibility. The operator simply takes the next card from the box when his last order is completed. This means the particular order which is written on each card can be changed up until the last minute, without production noticing.
The 4th principle of the Toyota way (Liker, 2004) states that one should always balance their workload to minimize variation (mura). Heijunka is the tool to put this principle to practice. Processes can be optimized to increase flexibility, stability and predictability of the process. Within assembly processes, the Heijunka box can combine the balancing principle with a visual management system in which one can see if production is producing to plan or not at all time.
Continue to
Lean Toolbox - The Production Lay-out
SOURCES:
Floyd, R.C., 2010, Liquid Lean: Developing Lean Culture in the Process Industries, Productivity Press
King, P.L., 2009, Lean for the Process Industries – Dealing with complexity, New York: productivity Press. (summary)
Liker, J., 2004, The Toyota Way, 14 management principles from the world greatest manufacturer New York: Mc-Graw Hill (summary)
Rother, M., 2010. Toyota Kata: Managing people for Improvement, Adaptiveness and Superior Results, New York: Mc-Graw Hill (summary)
Rother, M., Shook, J., 1999, Learning To See - Value Stream Mapping to Create Value and Eliminate Muda, Brookline, Massachusetts: Lean Enterprise Institute (summary)