Yamazumi (also known as Balance sheets) is a tool, which’s name could be translated into ´stacking mountain´. It is used to visualize variation in work cycles can be used for moth machine as well as operator cycles.
Within Lean, Variation (Mura) is one of the three enemies of lean. Variation can be found between products in a product family on one workstation, or for instance between workstations in one process. This variation leads to Waste (Muda) in the value stream in terms of waiting times and inventories.
The Yamazumi helps to identify these variations, with the goal of reducing it to increase the flow.
THE YAMAZUMI can be seen as a sort of stack-chart in which work cycles can be visualized by stacking different unities of work (see illustration 1). In this example, the total amount of work to produce one product is divided over 4 workstations (hence, the four columns).
Every block in the chart represents one task or unity of tasks. A unity of tasks is a combination of tasks which should not be interrupted. That also means every block in the chart can be handed over to another operator or machine. The smaller the blocks are, the more flexible the division of work can be at a later stage.
Using color-coding, tasks can be categorized as value-adding (green) and non-value-adding (red). This visualization will help defining possible improvements in the work cycles.
The Takt time is shown as a single line across the chart. Since the Takt Time shows customer demand, all work cycles should be shorter than the Takt time to be able to deliver all customers. If the customers demand changes, the Takt time line will move up or down the Yamazumi chart, visualizing both problems as well as opportunities for production.
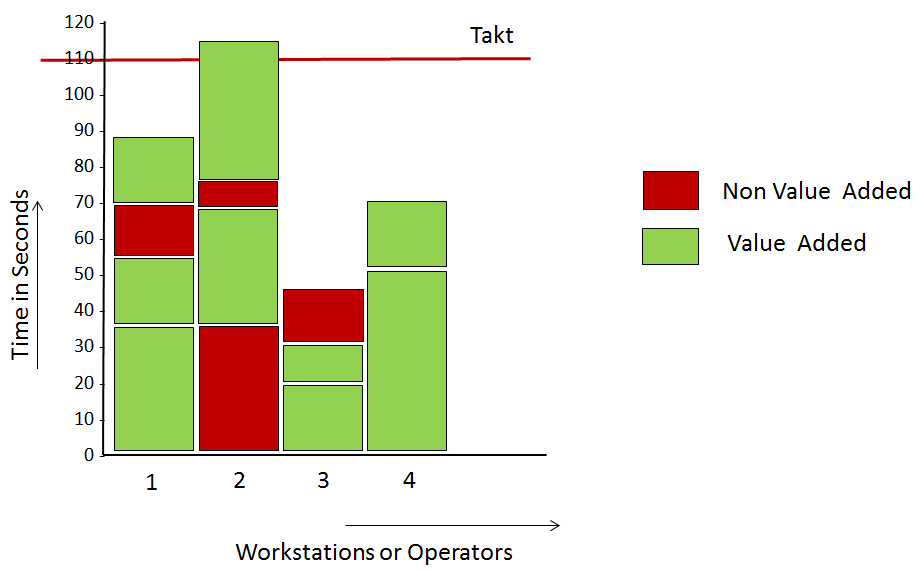
Illustration 1: Yamazumi, a tool to visualize machine or operator work-cycles
Like all other Lean Tools, the YAMAZUMI IS MENT TO LEAD YOU TO PROCESS IMPROVEMENTS. In its simplest form, the Yamazumi should therefore be built using post-it´s on a flip chart or magnet strips on a whiteboard. When each unity of work is represented by a post it or a magnet, it facilitates playing around with the chart to improve the flow of work for a certain product.
When developing a future-state Yamazumi, tasks should be planned up to the planned Cycle time, which should be about 95% of Takt time max (Duggan, 2002).
As a second step, non-value-added work should be targeted for improvements to be reduced or even eliminated. But also value added blocks can be targeted for improvement, for instance with the help of 6S.
After improvements, the work unities are moved to the left side of the chart as much as possible by maximizing the operator or machine work cycles as close to the planned cycle time as possible. By doing this, as is visualized in illustration 2, all waiting times are centralized at the end of the process at the last person or machine, which might be able to pick up another task in that time.
By planning the work cycles as close as possible to the planned cycle time, overproduction (when people produce more due to available time) or waiting times (people wait until the next cycle starts) can be prevented, which are both wastes (muda).
Illustration 2 shows an example of a possible result after improving the situation shown at illustration 1. The target cycle time is set at 100 seconds, the waste at workstation 2 is reduced with 50% on the first task, and part of the work unites from workstation 4 are moved to workstation 3.
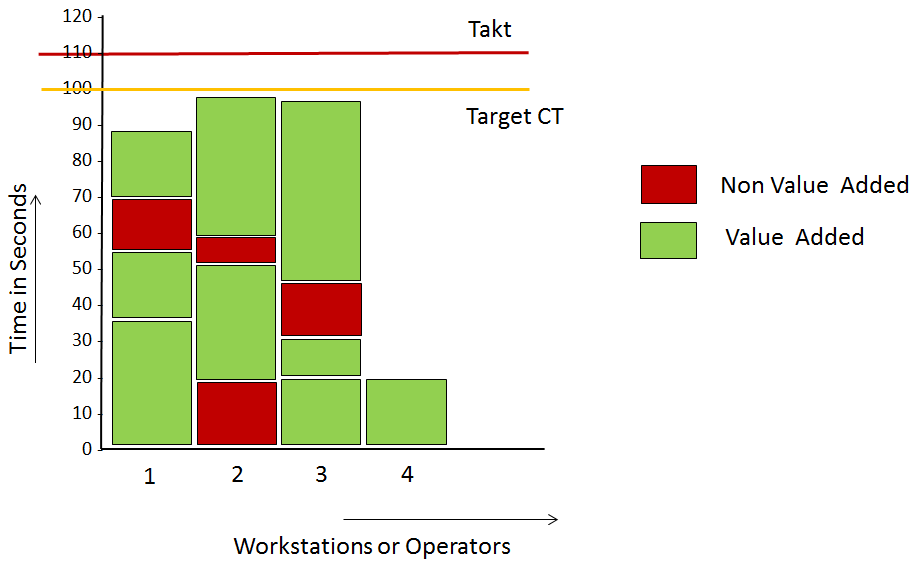
Illustration 2: Possible Future state of the Yamazumi shown in illustration 1
There are at least 3 SITUATIONS IN WHICH THE YAMAZUMI CAN BE USED.
The first application is at the level of process design. When a new product or product family is introduced, the Yamazumi can visualize the level of Flow for the new product(s).
The second application of the Yamazumi is in defining Product Families (Duggan, 2002) as part of process re-design. An important step in mixed model value streams mapping is to reduce the number of shared resources in the Value stream. Therefore, product families might be redefined. The Yamazumi can be built for sum of work units for the complete family. The total cycle time should be kept below Takt and the variance of cycle times between the different products in the family should be kept below 30%. The bigger the family, the more flexibility the value stream has, because a cycle time one product that exceeds Takt time, can be compensated by volume and cycle time for a second product in the same family.
Thirdly, the Yamazumi can be used to determine the product interval for Heijunka (product balancing). For each product family, the total Process times can be compared with the planned Cycle time for each workstation and visualize how much time is left for change overs between products within that family. With Heijunka, the product sequence is fixed, by comparing the total change over time needed to produce one whole cycle with the time available for all change overs in total, the Interval can be calculated. The shorter the interval is, the smaller the buffered inventory between workstations has to be.
The Yamazumi, or balance-sheet, can be used to visualize machine times and operator working cycles. Visualizing this variation can facilitate the choice for certain product families, helps to define the production interval and balance the workload per operator or workstation.
Most important is that the Yamazumi, just like other Lean tools, is used to systematically improve processes, by enlarging product families to produce closer to Takt time, or shortening the Heijunka interval to reduce response times and Work in Process (WIP).
Continue to:
SOURCE
Duggan, K.J, 2002, Creating Mixed Model Value Streams - Practical Lean Techniques for Building to Demand, USA: CRC press.