Value stream mapping is the tool that is used to improve process flow. Traditional VSM´s are used to describe the flow of physical products, in which a product is built by adding value to it in different linear steps. Office processes, and project processes in particular, are different. The ´product´ that is produced can be virtual, the process time can be months instead of minutes and, to make things even more complex, these type of processes are often multi directional and non-linear (Morgen & Liker, 2006).
This article describes the problems of value stream mapping in a project environment and how the VSM method can be changed to be able to visualize the problems that exist within projects: capacity and milestones. To illustrate, I describe an easy example of a Project VSM.
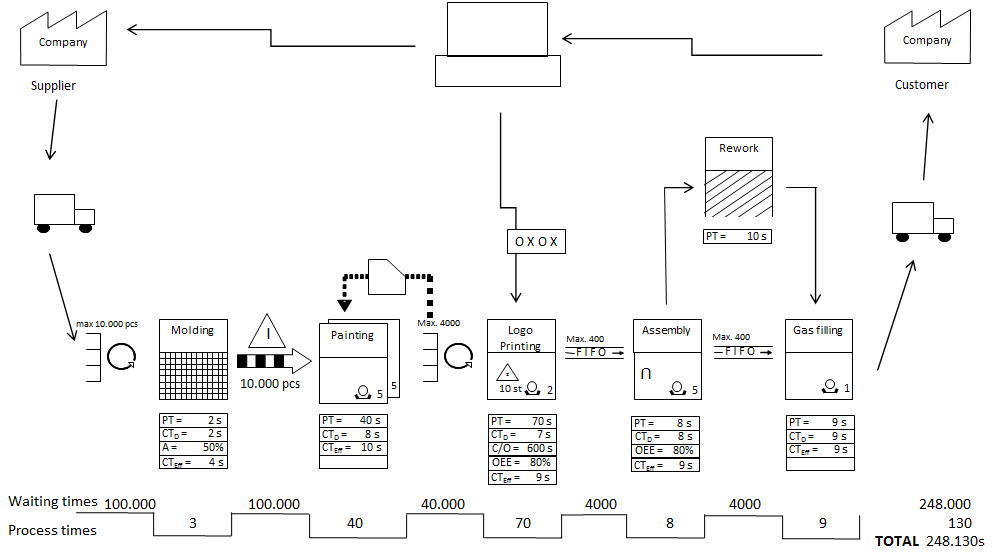
Illustration 1: traditional Value Stream Map for production
Illustration 1 shows us an example of a traditional VSM, the lighter factory example which I used to illustrate both the tool value stream mapping and the 8 steps of future state value stream mapping. When you have little knowledge about the different symbols and how the VSM is built, I can recommend to read these articles (highlighted above) first.
When the above form of value stream mapping is used in a project environment, THE FOLLOWING COMPLEXITIES usually occur:
Lead time should be the input of the VSM instead of the output. In traditional VSM, the lead time is the result of the flow of the process, the final step of value stream mapping which can be calculated when all process steps and connections between those steps are analyzed. In projects however, the lead time is usually the input for the flow of the process, resources are allocated based on deadlines and not the other way around.
Most waiting times can be found within process boxes instead of between process boxes. Traditional VSM is focused on reducing the waiting times between process steps. By implementing flow as much as possible, with the help of U-cells, FIFO lanes and supermarkets, this type of waiting time is reduced. In Project work however, most waiting times occur within the process boxes. People often need input and feedback from others after they have started, which means this waiting time is part of the process time. If we would create different data boxes for every sub-task within this task, the overall VSM would become highly complex and therefore more difficult to be able to still see the big picture.
Thirdly, most (if not all) people who work in projects are shared resources. Because of the dependencies of other people, people work on multiple tasks, in possibly multiple projects (value streams) at the same time. This has further impact on the waiting times within each process box.
Finally, people can work on one task simultaneously with different capacities and at different times. For instance, a team can be responsible for collection customer feedback to work on the Quality Function Deployment of a New Product Introduction project. One person can work 1 hour a day on this task, while 3 others might work for 4 hours a day on it. How would you visualize this in a traditional VSM? You would need enormous data boxes with the availability and capacity required for each of the team members who are needed within that process box.
A large part of in this article POSSIBLE SOLUTION is described by Morgan & Liker (2006). They describe an alternated form of value stream mapping, which combine some aspects of traditional value stream mapping, the process map, a swim-lane diagram and a Gantt chart.
The first difference between the traditional VSM and the Project VSM, is that the lead time ladder is put on top of the project VSM and that the project milestones are visualized on the timeline. The entire project can for instance be split into 5 phases of DMAIC, and each phase contains process steps with feedback loops in which data is exchanged.
Next to the activities done within a project, the critical decisions that need to be made to pass the milestones are visualized separately. This helps to visualize the importance of certain task within the project plan. Whenever a critical decision is delayed, the project is delayed.
Activities that are done by different teams, sub teams or individuals can be drawn in different swim lanes. The number of parallel activities and different action holders show the complexity of the project task and the workload leveling between these functions.
Just as in a traditional VSM, each process box contains a data box with data that is important to document to be able to make improvement decisions later. For the project VSM, the process time (PT) should be documented to know how long it takes to finish the job. I suggest to put the needed capacity in there as well, which is the process time multiplied by the number of people in the team. This will give us an overview of the number of Man Hours (MH) needed to complete each activity of the project.
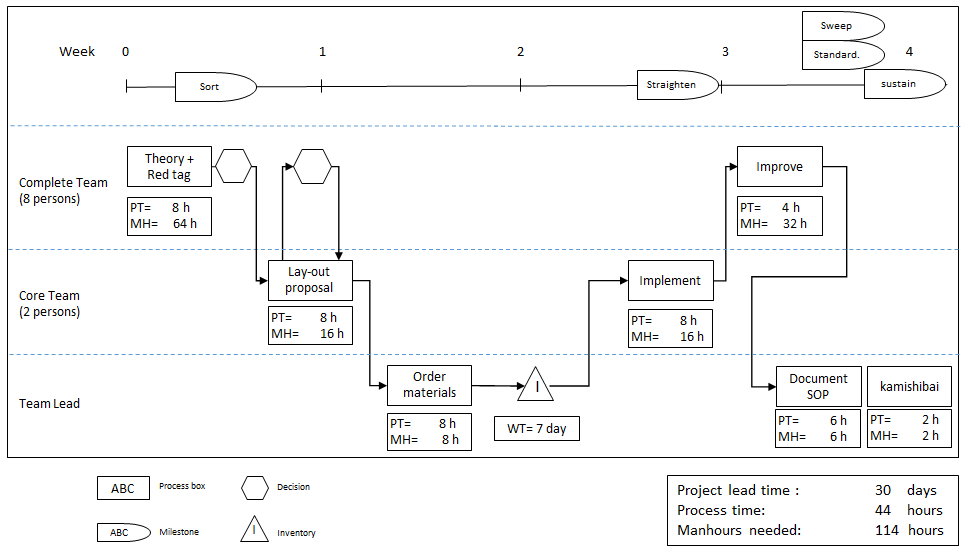
Illustration 2: Example of value stream map for a 5S project
Illustration 2 shows an EXAMPLE PROJECT VSM about the implementation of the first set of 5S standards. Because 5S is the foundation for every lean deployment and is therefore implemented in different departments on a regular basis, it is worth it to visualize the process flow of the process.
The first thing our Project VSM shows, thanks tot he lead time ladder at the top, is that implementing the first complete set of 5S standards in one department takes 30 days, when the 114 man hours are allocated to this project. Of course, this depends largely on the type and size of department. For each of the 5 Steps in 5S (Sort, Straighten, Shine, Standardize and Sustain) , a milestone is defined and visualized on the lead time ladder.
Underneath the lead time ladder, the activities and crucial decisions that are necessary to pass the milestones are drawn. For instance, to be able to finish the ´sort´-phase, the team needs consensus on what tool they need to be able to do their work, which will later be put on a shadow board (standardize), to prevent a lot of rework at later stages.
In this example, the first version of the lay-out is worked on by a sub-team, but they are in constant interaction with the rest of the team, hence the feedback loop. In practice, this feedback could be gathered in the daily team board meeting.
In terms of waiting time between process boxes, the waiting time for material delivery takes up a large part of the total project lead time.
Finally, the necessary capacity in terms of process time and Man Hours (MH) is captured in the VSM. In this example, the total number of MH= 114, spread over the 30 day project lead time. It is of course also possible to calculate the number of MH for every swim lane. Assuming a normal workweek of 40 hours, the total process time of 44 hours tells us, that when we can deliver all the materials up front, we could also choose to plan a one week kaizen event in which the entire project is executed.
The goal of value stream mapping is to map possible problems that lead to delays of the project, the obstruction of flow. It is the task of the project team to react to these problems and to define actions to solve them before the delivery of the project results is in danger. When the above changes are embedded in the way of managing projects, it will be both an important planning tool and a KPI. For project that are longer than a few months, the Project VSM should be part of the daily (or weekly) project meeting that is held in the Obeya, to make sure all the deadlines are met.
Continue to:
Office Kaizen - W.Lareau (summary)
REFERENCE:
Morgen, J. M., & Liker, J. K. (2006). The Toyota Product Development System. New York: Productivity Press. (summary / order this book)