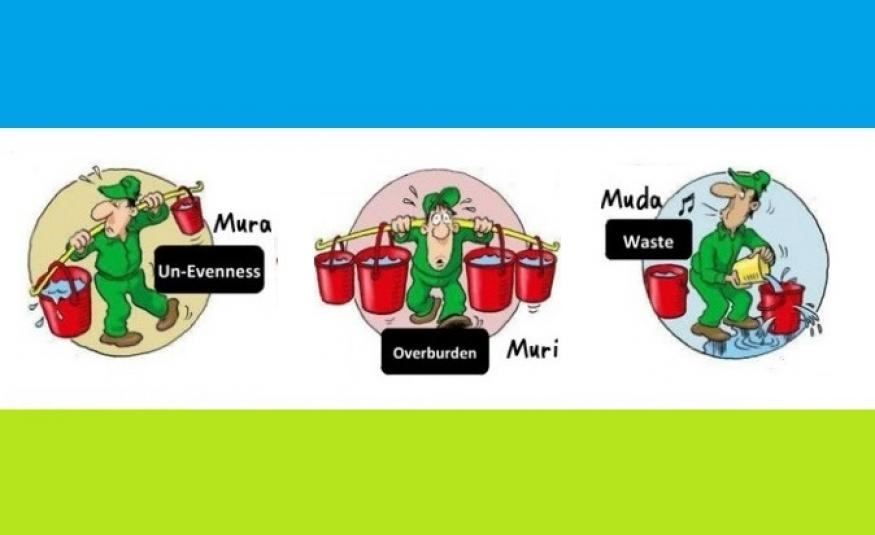
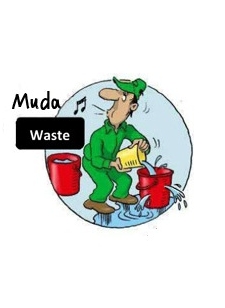
Muda is the Japanese word for waste and includes non value adding activities that prevent flow and lead to longer lead times. We consider all activities as non value adding, that a customer would not be willing to pay for if he would have the chance to decide. Originally, (Ohno, 1988) defined seven types of waste, all of which are interrelated. A little later, an eighth waste was added to the Toyota handbook (Liker, 2004).
Here are the eight different wastes as descibed in Lean Transformations (Panneman, 2017), each with an example of that waste production and in the office environment and lean tools on how to find and eliminate them. As Mnemonic device, the first letters of the eight wastes form the acronym DOWNTIME.
DEFECTS are products or services that are moved to the next process step, but not confirm customer specs. In a production environment, a defect could be a product (part) that does not function properly, or a product that is incomplete when it arrives at the customer.
A defect in an office environment could be a typo in an IT system, which prevents the process from continuing, or even sending a wrong attachment in an E-mail.
Defects usually lead to rework and/or extra work, to make sure the customer receives the products or service he ordered. Because this process includes a feedback loop from the (internal) customer to the workstation and extra time spend to fix the problem, defects have a negative influence on the lead time and therefore flow of the process.
At least two tools can be used to prevent defects from happening: Poke Yoke and Standard Work. Poke Yoke is the Japanese method of eliminating the possibilities of building defect products. One example is the USB stick and port. There is only one way the stick fits in a computer slot, therefore it is almost impossible for a person to connect the USB stick to the computer in the wrong way.
There are two different types of Poke Yoke systems: warning systems, which send a signal when there is a deviation from the standard, and control systems, when a machine automatically stops whenever there is a deviation from the standard (Singo, 1989).
Standard work means each task should be described in detail in the so called Standard Operating Procedures (SOP’s). When tasks are performed in a standard order, chances one task is forgotten reduces. Next to that, variance (mura) due to different operators performing the same tasks are reduced. In a lean production system, everybody should have some form of standard work, even if nature of the job only allows you to specify a percentage of the total job (Mann, 2005).
|
These are the books that
|
 |
 |
 |

OVERPRODUCTION means producing more than the customer needs at this point in time. This is a waste because resources are already invested in products or services, that will not be worked on after the current process step.
One example in production is producing components that are needed further downstream of the workstation, but it is unknown when they are needed exactly. I personally have encountered products in warehouses, which have been sitting there for multiple years waiting to be processed.
In the office environment, the input of electronic tickets for change requests for IT or engineering can be considered overproduction, when the resources the receiving department are restricted and it is uncertain whether or not they have the capacity to work on the request. The people who need the IT changes simply push the next number of requests into the system, hoping they will be implemented, spending time following procedures and filling out forms.
Overproduction is sometimes referred to as ´the mother of all wastes´, because it leads to all other kinds of waste because the product or service moves through the entire process with both value adding as well as non-value adding activities.
This type of waste can be reduced using tools like SMED and Kanban. SMED is an abbreviation of Single Minute Exchange of Die, which basically means ‘Quick Changeover´. When changeovers are short, it can be economically interesting to produce in smaller batches and therefore reduce the time part of a batch is waiting to allocated to an order. SMED at high level consists of two steps:
- Do as much tasks as possible when the machine is still running on the current batch, and
- Reduce the number of time needed to do tasks with the machine offline, using parallelization of tasks, implementing small machine changes and the design of tools (Shingo, 1989). This can be done by eliminating tasks, or doing some tasks in parallel.
The second tool which can be used to reduce overproduction is Kanban. Kanban (Visual Card) is a self-managing production system, in which the material moves down the value stream, while the information about what to produce moves upstream (Geiger, Hering, & Kummer, 2011).
With Kanban, signals are sent from the end of the process (customer order) in which it specifies exactly how much of a product has been used up downstream, which needs to be replenished.
Every workstation receives its own signal (usually an actual plastic or cardboard card) from its downstream workstation, which informs the upstream station on what product to produce and how many.
In the office environment, every task that needs to be done can be visualized on post-its on a board which contains three columns: to do, in progress and finished tasks. The maximum number of tasks in progress can be defined, which means a new task can only be started when another one was finished. In this case, only when a team member has finished a task, he can request the next one.
WAITING is the third waste and includes parts, e-mails and SAP actions that are waiting to be completed on the shop floor, in somebody´s mailbox or in the ERP system. And what about all the people that are waiting for one person at the start of a meeting? These are all non-value-adding times in the process, directly increasing the lead time and preventing flow.
Waiting time can be interrelated to inventory. Whenever products are sitting in inventory, they are technically waiting to be processed. The same holds for E-mails waiting to be read or answered. This is why inventories on the value stream map are measured in waiting time.
Tools that help find waiting time in a process are time studies, takt time and line balancing.
Time studies describe the entire process in different types of time. One can define process times, waiting times and lead times. Process time is the sum of cycle times where value is being added to the product. Waiting times are the times where a value is not added to the product, for instance when it is waiting for a process step to start, of being moved to another station. By measuring and visualizing these different times, improvements (or kaizen) can be focused on a single point in the process at a time.
Takt time is the beat in which the customer actually demands the product. For instance, when customer demand is 365 products a year, takt time is 1 product a day. This means the factory should ideally produce 1 product a day, to stay flexible for changes in customer demand. When production is faster than takt, products have to wait in the warehouse until they can be shipped to the customer. When production is slower than takt, even worse, the customer has to wait for his order.
The third tool to reduce waiting times in a process is line balancing. This tool is used to balance a line in a way that all sequential workstations have equal cycle times (Duggan, 2002). When the cycle time or station 2 is larger than station 1, every product that comes from station 1 has to wait, or station 1 has to wait until station 2 has finished its cycle. A visual way to balance a production line is the yamazumi.
NON-USED-TALENT includes employee knowledge and skills not being used to their full potential. For instance, a high skilled worker has to do work that is relatively easy, or is firefighting all the time instead of focusing on continuously improving on the long run. Firefighting by itself is a waste, (excess processing) when the problem is not really solved.
Another example is not inviting the expert of a workstation to the value stream mapping events and thereby failing to use his input to identifying the problems within that value stream. This could lead to an entire management team focusing on the wrong problems to solve, having to do it all over again at a later stage.
The tool to reduce this non-used-talent is training. Toyota invested six times as much training hours for new employees than North America, and more than twice to Europe (380, 46, 173; (Womack, Jones, & Roos, 1990)). Everyone in the organization should be trained to use tools like 5S, standard work, team boards and kaizen. Within these four tools, the kaizen loop supports incremental improvements done by the operators, which can be shared using the team boards and documented in standard work and the 5S standards.
Next to these tools, employees should be trained in practical problem solving using 5x why to get to the root cause of a problem instead of fixing symptoms.
TRANSPORT includes all movements of product between workstations, paperwork between departments, or digital processes between multiple individuals. The product moves around without actually being altered, which means it increases the lead time and even man hours when a physical product is being transported, without adding value to the customer.
Tools to reduce transport in production is creating a production line or work cells. To minimize transport of tools by people, 5S can be implemented.
With spaghetti diagrams, one can draw all movements of products and tools with a pen on a plant map. This is a perfect moment to use the circle of Ohno. Observe every movement and draw them on the map.
One way to reduce the amount of transport in production is by changing the layout of the plant into production lines in which a product flows through the same workstations in the same order. A second option is the use of work cells, where small production lines are built in a U-shape. Input and output of each workstation should all be on the same side to reduce distance between cells. A product can flow through the cells needed for that particular product.
For paper processes in which lots of signatures are necessary, like quality issues or project charters, having a fixed moment in de day where the majority of people meet to work on those charters in one go (in a work cell fashion) is a possibility to prevent one person from walking around the entire site searching for people to sign the document.
Finally, the transport of tools by operators can be reduced using 5S. When every workstation has a standard location to keep all the tools needed at that workstation, in the form of shadow boards for example, the operator does not need to walk around and look for a tool needed.
INVENTORIES are the products or services that are waiting at a workstation, in an E-mail account or in the ERP system to be completed. There is a clear link with waiting here, since products are actually waiting to be worked on in an inventory. The more parts are waiting for the same operation, the longer one particular part has to wait its turn.
Again, waiting times directly increase the lead time of a product or service and therefore make the organization slower in responding to customer demand. Next to that, physical inventory costs money: Material costs, depreciation costs, physical space costs, management costs, insurance costs, and the costs of possible redundancies or damage. Depending on the product, these costs together could sum up to an 18-35% on a yearly basis (Dominick & Lunney, 2012).
Tools that can help reduce the amount of inventory in production are the already described work cells and Kanban.
A third tool to reduce inventory is creating One-Piece-Flow. Within a One-Piece-Flow, batches are reduced to one item. This way you immediately reduce the amount of WIP with a factor of the size of the current batch size.
MOTION describes the movement of people and machines without actually working on the product or service. For instance looking for the right screwdriver to tighten a screw in production or searching for a document for 10 minutes on the local drive to send it in the attachment of an E-mail in an office environment.
Next to the fact that it takes time to reach that part or click through multiple folders on your computer, motion has a clear link with overburden (muri) as well. Parts that are put high up a shelf or down near the floor lead to ergonomic challenges for the employee.
Motion is one of the wastes that should not always be removed to zero. Taking out the most difficult motions of a person´s work cycle might be an improvement in terms of ergonomics, but taking out all movement might have a negative effect on health, which can lead to a lot of other problems with long absence as a possible result.
Tools which help you reduce the waste moving include the tools Standard Work, 5S and Spaghetti Diagrams, which have already been described above.
EXCESS PROCESSING, means doing extra things that the customer is not asking for. This could include building in product features- or adding more accessories that the customer does not really need, but also the rework that is necessary to repair defects. Adding packaging materials for internal transport (between different floors, departments or even sites) which are then removed again are also examples or excess processing.
In the office environment, excess processing could mean adding more pages or text to a document than necessary or spending time in making an extra fancy layout for a presentation for your manager.
The first tip in reducing this type of waste is by simply asking your customer whether he or she really needs those E-mails, reports, bells & whistles on the product and slide lay-out.
The tool that can be used to systematically find non-value-adding activities is a process map. This is a kind of flow chart with six types of symbols (process step, delay, inventory, decision, measurement and transport). The best way to create a process map is by observation, to make sure you draw all the hidden wastes in the process that are not written in the ‘official’ way of working.
Observation is not only important for creating a process map. The best way to find wastes, is to observe them (Ballé & Ballé, 2005). Taichi Ohno was famous for his ´standing in the circle´ exercise, where managers had to stand on one spot in the factory and simply observe what wastes they could see (Liker, 2004).
The same would work in an office environment. Simply taking the time to really see what is going on in a process can be the input for a long list of wastes.
Again, it is important to understand, that a lot of muda is designed into the system to buffer for problems and prevent one problem from leading to more problems on downstream workstations. One example is the use of inventories between to machines, to prevent de second machine from starving when the first machine is broken down. Simply taking away the inventory does reduce the lead time on paper, but definitely does not solve the problem that was hidden by the inventory, in this case the reliability issues of the first machine.
Usually, muda derives from one or both of the other two enemies of lean: muri (overburden) and mura (unevenness).
This is article 2 from the series ‘The 3M model’
Continue to:
Finding Muri (overburden) in your Process
|
These three lean books are
|
  |
  |
  |
REFERENCES:
Ballé, F., & Ballé, M. (2005). De Goudmijn - een Roman over Lean Transformatie. Driebergen (NL): Lean Management Instituut. (summary / order this book)
Dominick, C., & Lunney, S. L. (2012). The Procurement Game Plan – Winning Strategies and Techniques for Supply Management Professionals. Ford Lauderdale: J.Ross Publishing. (order this book)
Duggan, K. J. (2002). Creating Mixed Model Value Streams - Practical Lean Techniques for Building to Demand. New York: CRC press. (summary / order this book)
Geiger, G., Hering, E., & Kummer, R. (2011). Kanban. München: Hanser.
Liker, J. (2004). The Toyota Way, 14 management principles from the world greatest manufacturer. New York: McGraw Hill. (summary / order this book)
Mann, D. (2005). Creating a Lean Culture - Tools to sustain Lean Conversions. New York: Productivity Press. (summary / order this book)
Ohno, T. (1988). Toyota Production System: Beyond Large Scale Production. Cambridge: Productivity Press. (order this book)
Panneman, T, 2017, Lean Transformations - When and How to climb The Four Steps of Lean Maturity, Maarssen (NL): panview (summary / order this book)
Shingo, s. (1989). A Study of the Toyota Production System from engineering Viewpoint. New York: Productivity Press. (order this book)
Womack, J. P., Jones, D. T., & Roos, D. (1990). The Machine that changed the world: The Story of Lean Production – Toyota´s Secret Weapon in the Globar Car Wars that is Revolutionizing World Industry. New York: Free Press. (order this book)
![]()
The following 2 minute video from Orbussoftwaretv,
contains a short and sweet explenation of the 8 wastes: