Muri, or overburden, means that operators or machines are pushed through their natural limits, which leads to problems (Liker, 2004). The quality of the output suffers because of the state of the machine or person performing the output is in, which means muri leads to muda (Hines, Found, & Griffiths, 2011). This article describes a big part of a chapter in my book Lean Transformations, which explains how you can understand muri in both the machine environment as well as the human resource management (Panneman, 2017).
One example is the overheating the battery of an old car which leads to breakdowns (=defects), or using heavy software on your personal computer that does not have the memory power to do calculations quickly, which leads to waiting time.
In terms of human muri, being stressed can lead to you wanting to do something really quickly, which usually leads to more defects. Or even worse, you get overburdened and cannot work at all for a while.
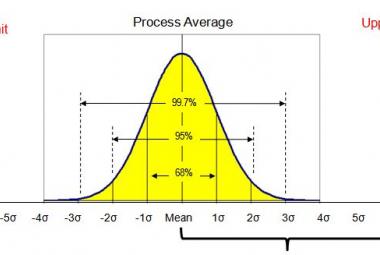
Not only does muri lead to defects, it also leads to longer waiting times (Gort, 2015). Queuing theory shows us that the lead time of a process increases exponentially when the utilization degree increases (Hopp & Spearman, 2000). The lead time doubles when the utilization of a process increases from 80% to 90%, and doubles again when it increases from 90% to 95% (Gort, 2015).
So since lead time is the one measure that reduces all three aspects of the iron triangle: cost, delivery and quality, it is wise to prevent the utilization degree of your processes, machines and people to exceed 80% (Howell, Ballard, & Hall, 2001).
In a MACHINE ENVIRONMENT, muri is depending on machine performance and machine performance can best be measured by Overall Equipment Effectiveness (OEE) of the machine (King, 2009).
the OEE includes measures for availability, performance and quality, with the goal to prevent the machine from breaking down.
Machine related muri can be minimized by maintaining all machines as effectively and efficiently as possible. To improve the OEE of a machine and prevent muri, both preventative- and autonomous maintenance can be used (Tajiri & Gotoh, 1992).
Preventative Maintenance means a machine should be kept in operating condition by means of inspection, detection and prevention of failures (Wireman, 1992). By maintaining the good shape of the machine, break-downs can be prevented which would otherwise lead to defects or even worse: accidents. The underlying thought here is that preventative maintenance is cheaper than waiting for the machine to break down and having to fix it. Preventative maintenance does not only reduce machine muri, it also reduces mura for the technical staff because the number of unplanned jobs they receive decreases, while the number of planned maintenance jobs increases.
one example for preventative maintenance is to get your car checked up at a garage regularly, to prevent you from having breakdowns while you are out and about.
Autonomous Maintenance is the next step after preventative maintenance and means that operators routinely perform key maintenance task on a machine, that traditionally has been done only by the best few individuals (Floyd, 2010). The underlying thought is that operators work with the machines all day, so they notice abnormalities instantly. Next to that, they (again) reduce the workload of technical staff.
Our car check-up might be too complicated for most of us, but to keep the chain of your bike lubricated and the tires hard, are examples of autonomous maintenance in which the owner himself can prevent breakdowns at a latter stage.
Implementing Autonomous Maintenance is described in seven steps (Tajiri & Gotoh, 1992): Initial Cleaning (1), Prevent Contamination (2), Create cleaning standards (3), total machine inspection (4), Standard Interval for total machine inspections and cleaning (5), Preventing defects to ever reach other workstations (6) and focused improvement activities to increase OEE for the machine (7). A detailed description of Autonomous Maintenance can be found >here<.
Whether or not it is cost efficient to have a preventative (or autonomous) maintenance program on a machine can be calculated by comparing the costs of breakdowns (number per year x coast per repair x costs of lost production) with the costs of inspection (cost of activity x number of inspections per year) (Wireman, 1992).
|
These are the books that
|
 |
 |
 |

In the HUMAN ENVIRONMENT, muri can be identified with the lagging indicator employee absenteeism. In the 21st century, more and more people end up at home with a burnout, which means they are literally overburdened up to a point where they cannot perform anymore for a period up to six whole months (Westendorp & van Bodegom, 2015).
Apart from absenteeism, Yerkes & Dodson (1908) already found that for complex tasks, performance as result of level of arousal is like a parabola in which performance increases when the arousal rises, but only up to a certain point. After that, more arousal (then perceived as stress) leads to a lower performance (Yerkes & Dodson, 1908).
Tools that help reduce people related muri are the team board, 5S, Standard work and using Jidoka principles. Absenteeism due to overburden can partly be prevented using a Team board which include metrics like the amount of over hours made, stress levels of individuals, or even team members’ mood, to make these topics part of the daily communication within the team. Obviously, only visualizing data is not enough to reduce the over hours and improve people’s mood. Action need to be taken!
5S, or 6S, which leads to an organized workstation, prevents people from having to search for materials or tools and therefore reduces time for searching, but also stress (Asefeso, 2014).
Standard work describes the safest and most efficient method of performing a task. Having clear Standard Operating Procedures prevents people from doing un-safe actions to get the job done, by using a machine the wrong way or moving too heavy products by hand.
Jidoka describes the possibility to stop the production line whenever there is a problem (Gorecki & Pautsch, 2010). At Toyota, this translates into the so called andon, a cord hanging above the production line. Whenever an employee pulls the cord, production is stopped across the entire line. All employees are notified by visual- and sound signals telling them where the problem occurred. With the line stopped, people can completely focus on solving the problem at hand. Stopping the line also prevents the error from infecting multiple products or batches and therefore more defects. The jidoka principle is described in four steps: Find a deviation (1), Stop production (2), Fix the problem (3) and analyze the root cause of the problem & prevent it from happening again (4).
The link between muri and muda goes both ways. When machines or people are overloaded, more mistakes are made that could lead to defects, but muri can also result from removing too much muda (waste) from the process. When a buffer of inventory (muda) is removed without changing the actual reason why the inventory is there in the first place, chances are, inventory is there to buffer for unevenness (mura) to prevent overburden (muri), therefore simply removing the buffer will increase muri again (Hopp & Spearman, 2000).
Even though the tools above influence muri, the most important factor that influences the muri has not been mentioned yet: mura, or variability (Hopp & Spearman, 2000). This is what the next article is all about.
This is 3/4 from the series ‘The 3M model’
Continue to:
Toyota 3M Model - Finding mura (variation) in your process
REFERENCES:
Asefeso, A. (2014). 5S Office Management. Swindon: AA Global Sourcing Ltd. (order this book)
Floyd, R. C. (2010). Liquid Lean: Developing Lean Culture in the Process Industries. New York: Productivity Press. (order this book)
Gorecki, P., & Pautsch, P. (2010). Lean Management. München: Hanser.
Gort, R. (2015). Lean Vertaald naar Projecten - Samen leren bouwen aan Innovatievermogen. Amsterdam: Lean Vertaald.
Hines, P., Found, P., & Griffiths, G. (2011). Staying Lean: Thriving, Not just Surviving. Boca Raton: CRC Press. (order this book)
Hopp, W. J., & Spearman, M. L. (2000). Factory Physics, sec. edit. New York: McGraw Hill. (order this book)
King, P. (2009). Lean for the Process Industries: Dealing with Complexity. New York: CRC Press. (summary / order this book)
Liker, J. (2004). The Toyota Way, 14 management principles from the world greatest manufacturer. New York: McGraw Hill. (summary / order this book)
Panneman, T, 2017, Lean Transformations - when and how to climb the four steps of Lean maturity, Maarssen (NL): panview (summary / order this book)
Tajiri, M., & Gotoh, F. (1992). TPM Implementation – A Japanese Approach. New York: McGraw Hill. (order this book)
Westendorp, R., & van Bodegom, D. (2015). Oud worden in de praktijk – Laat de omgeving het werk doen. Amsterdam: Atlas Contact.
Wireman, T. (1992). Inspection and Training for TPM. New York: Industrial Press. (order this book)
Yerkes, R. M., & Dodson, J. D. (1908). The relation of strength of stimulus to rapidity of habit-formation. Journal of Comparative Neurology and Psychology(18), 459-482.
|
Here are three of the lean books |
  |
  |
|


![]()