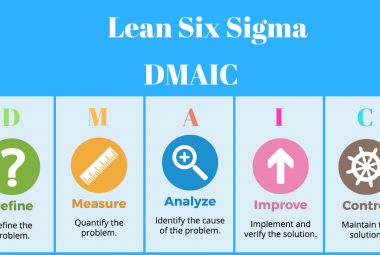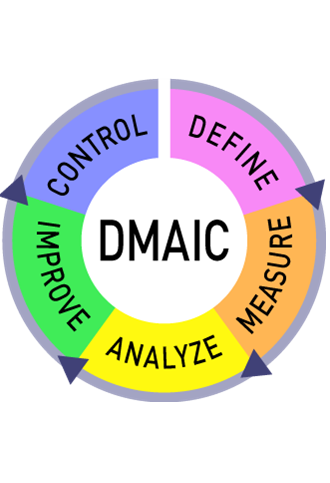
This is the third article in the series about the D2MAIC project structure for yellow belts. In part 1, we discussed the Discovery and the Define phase. In part 2, the Measure and Analyse phase are explored. This article describes the Improve and Control phase of the project.
The IMPROVE PHASE of the project is about implementing countermeasures that can solve the problem described and analysed in the previous phases. There are three goals in this phase: to generate improvement ideas, selecting the right countermeasure, and implementing the countermeasures.
For idea selection, an easy tool to use is the benefit-effort matrix. Simply pot all the generated countermeasures in the graph based on the estimated effort it takes to implement (technical effort, costs, resources) and the benefit it brings in terms of achieving the project goals defined in the Define phase.

Figure 1: benefit-effort matrix
When it is defined what you need to implement, it is time to define when it will be done. This is where the implementation plan comes in. The plan should include the actions that were defined in the previous step, on a timeline which schedules the tasks for specific days or weeks (see figure 2).
Usually, there are two rows per action, the planned timing (in blue) and the actual timing (in green). Of course, the actions can be broken down into smaller actions, and can have different owners.

Figure 2: example implementation plan
A planning tool that will bring your project plan to the next level is the PERT chart, in which PERT is an acronym for program evaluation and review technique. In the PERT chart, you do not only visualize the tasks on a time-line, but you show the critical path of the project.
The example in figure 3 shows the basics.
-
The red actions show the critical path, the blue actions the other actions
-
Each activity has 6 variables, three on the top and three on the bottom.
-
The top row shows us the day the action starts, the number of days the activity takes, and the end day of the action. Take activity E for example: this activity takes 5 days, starts on day 10 and will therefore be finished on day 15.
-
The bottom row shows us what the maximum delay of a task can be without delaying the entire project, with from left to right: the latest possible start date, the maximum number of days delay and the latest possible finish date. When we look at activity be for instance, we can see that it has to be finished at day 10 for the project to still be on track. The difference between 10 and 6 (top right) is 4 days of maximum delay. This means that the activity should start at (0 + 4 =) day 4 at the latest.
-

Figure 3: example PERT chart
The final phase of the project is THE CONTROL PHASE. This is where we it is proven that the actions from the implementation phase have led to the improvements that were targeted for this project, the sustainability of the results are assured, and success is celebrated.\
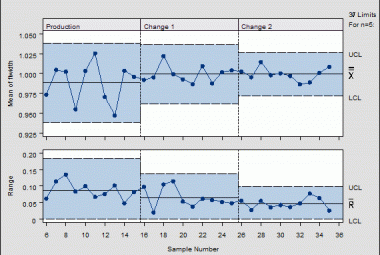
One easy way of showing improvements is using Statistical Process Control (SPC). Within this tool, process charts can show the behaviour of a process in statistical terms.
Figure 4 shows one example of the process chart in which improvements have been made at the end of the first quarter of the year, which led to measurable improvements at the second and third quarter.
We can see that the average value (the green line) has been reduced to 10, and the variation of the process is reduced, and moving between 25 and -2 (the upper and lower control limits, red lines.

Figure 4: example process chart
To sustain the results of the project, it is important that new ways of working are documented in Standard Operating Procedures (SOP) and to inform or train the workforce about the new way of working.
In my dream factory, every team has physical SOPs on workstation where the task is performed. Whenever there has been a change in the way of working, the new SOP will be distributed to the people during the daily team board meeting. The process chart shown above can also be posted on the team board to keep tracking the results for a certain timeframe.
To make sure the new instructions are followed, you could choose to create a temporary kamishibai check on this topic. Kamishibai is the mini-audit that helps us to randomly see if people are aware of the changed document and whether they are working according to it.
Next to kaizen and A3, projects are a way of improving your business. Ideally, they are directly linked to your organizational goals and take about 6 months to complete. D2MAIC in turn is a way of managing a project, and is commonly used within Lean (or) six sigma programs (though many organization do not add the discovery phase as an official step, they only use DMAIC).
Following the phase structure helps both the project team and the management team to track progress of the project, to make sure the yearly targets of the organization are met. D2MAIC is therefore a very valuable tool.
Continue to: