Team boards are used for communication within shifts, between shifts and between different departments. By visualizing important events of every shift on the team board, the information flow is visualized which prevents people from forgetting to share information with their peers (Suzaki, 1993). A Team boards should include the following three parts: people, performance & continuous improvement and an example is shown in illustration 1.
The three sections of the team board form the agenda of the meeting; you simply address all parts of the team board from left to right and from top to bottom. The goal should be to have the meeting within 15 minutes when it is a daily meeting, maybe half an hour when it is a weekly meeting.
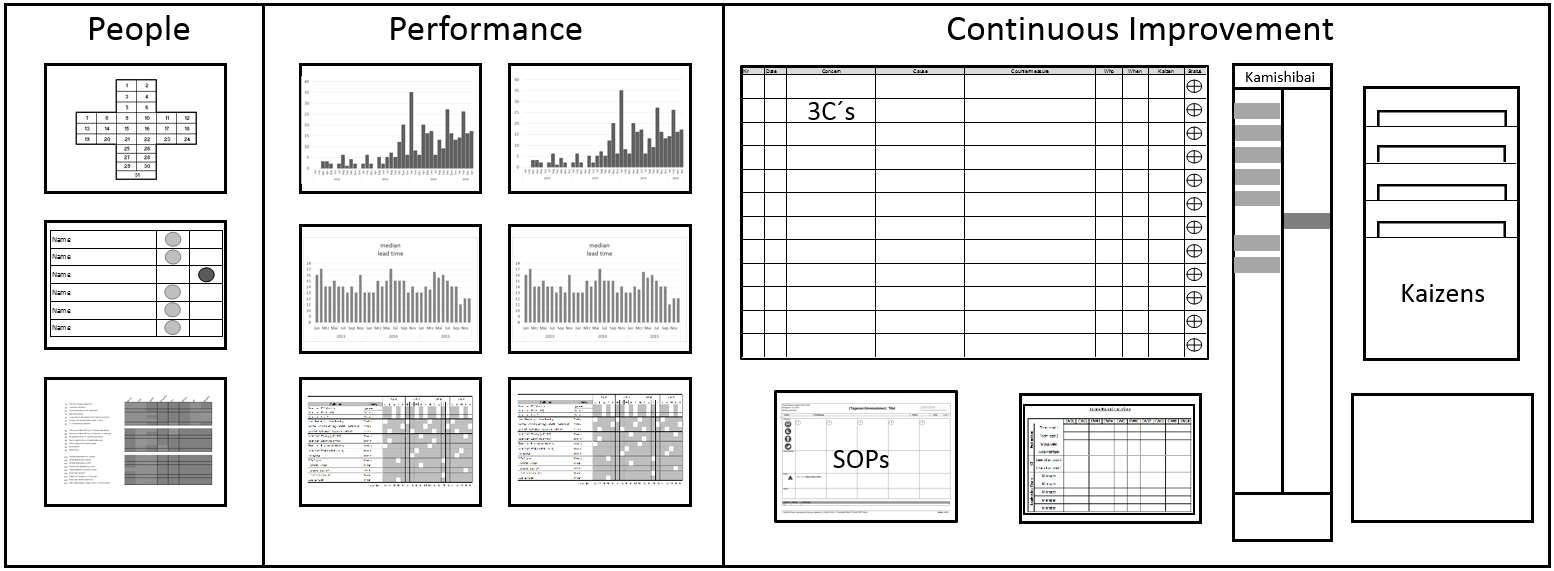
Illustration 1: Team board example 1 (level 1) REFERENCE: Panneman (2017)
The PEOPLE part includes the topics safety, presence and or mood, and a trainings matrix.
A Safety Cross can be used to visualize performance in terms of safety. It shows whether accidents or near misses have occurred in a glance. When a shift or day is colored red, the event should be written down at the 3C list at the continuous improvement part to improve the way of working and prevent the situation from happening again.
In an office environment, a mood board can be used, where all team members can address their current mood if they wish to. This way, topics such as workload and number of over hours can be put on the team meetings agenda.
Thirdly, the people part of the team board should include a summary of the skills of employees, in the skills- or training matrix. By using different colors for different levels of training, the training matrix visualizes the need for training within a team. The goal of the trainings matrix is to show the gap between the current level of skilled employees for a certain skill and the goal.
Part 2, PERFORMANCE, includes KPI for that specific workstation or department. The KPI section should at least include the following categories: Quality, Delivery and Reliability (Ballé & Ballé, 2005). There are different ways of visualizing performance on the Team board.
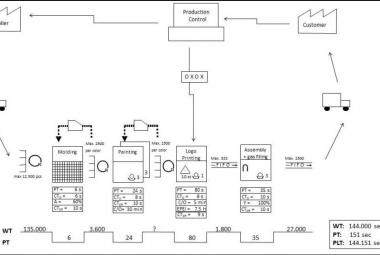
KPI’s can be visualized using graphs, tracked per shift and should include a target line (Ballé & Ballé, 2005) (Suzaki, 1993). The example in Figure 11 above shows a team board in a process environment. In this case, the performance KPI´s were focused on the Overall Equipment Effectiveness (OEE), since this was the one KPI that had the largest impact on product costs. Other KPI´s measured in the example above are the results of the preventative quality checks. Deviations from target should again be mentioned on the 3C list at the Continuous Improvement part of the cell and preventative actions for future prevention of the deviation should be implemented using Kaizen.
|
These are three books
|
 |
 |
 |

There are different theories about target setting. The first theory is, that targets should be stretching, which means the target is set in a way that the target is achieved 50% of the time, to show that the target actually can be achieved, and is not met the other 50% of the time, to show there is still possibilities for improvements (Webers, 2010).
The downside of this strategy is that 50% of the time, the red KPI should be addressed on the 3C board, which leads to a fast growing list of entries. This can be solved adding another layer of data entry to the team board structure, as shown in the second example team board, illustration 2.
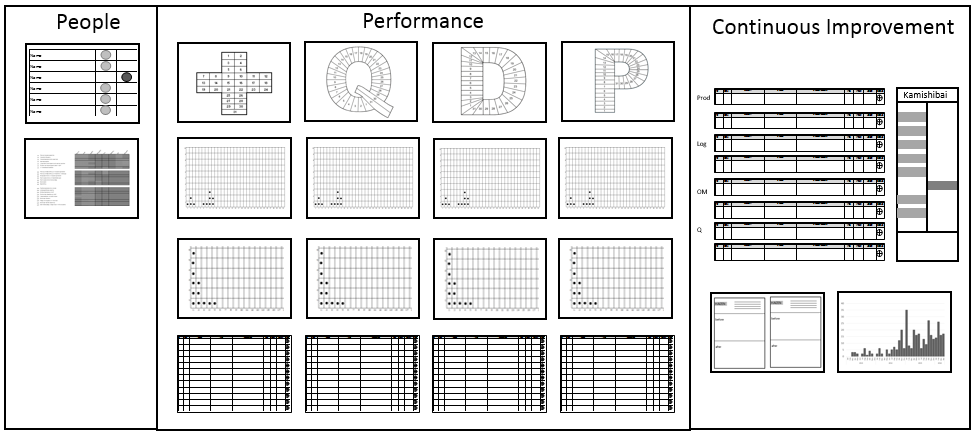
Illustration 2: Team board example 2 (level 2/3 board)
This example is from a level 3 team board, which means this is a board where performance of multiple other boards come together for a management team. In this case, we do not want managers to define actions when KPI is red and an action is already defined at the lower level. Instead, we create a visual overview in the first row (red-green), a breakdown of the red days in the second row, and a pareto chart of possible causes in the third row.
Only when the pareto shows there is a structural problem in the organization, the team at this level will create an action.
A second target setting strategy is to set the target in a way that the KPI is achieved 90% of the time. This way, only 10% of the time a red KPI has to be addressed on the 3C list, plus, this gives the Manager of the team way more opportunities to positively reinforce his team members for achieve the targets (Daniels, 2000).
Next to the discussion whether or not the target is set to be achieved 50 or 90% of the time, the problem with the KPI´s quality, delivery and reliability is that they are lagging. This means, when the team meets in the morning for their daily stand-up meeting, they look back at yesterday with no possibility to change the number. Also, the team might not be able to influence all KPIs for a 100%.
A better way to track performance would be to list (leading) behaviors that the team should show, which as a result lead to better results (Daniels, 2000) (Webers, 2010).
Examples of measurable behavior in a production environment are:
- Performing a 5S check on the workstation before starting the shift,
- The number of proper root cause analysis done on defined problems,
- % of Non-conformity processes started compared to number of quality issues
- Documenting new found solutions in the standard work, or
- How often Kamishibai cards are changed to sustain new improvements.
Examples of Lean behaviors that could be part of a Leader´s standard work or supportive functions include:
- The number of 3C´s (concern, cause, countermeasure) he solved for the production team,
- The number of kamishibai´s he has done, and the number of improvements (kaizens) that resulted from them
- How often he gave positive reinforcement to his team members
Examples of Leader standard work in the form of checklists are described in the article on Leader standard work, we can however also a similar list as a KPI for an entire team, see Illustration 3. In this example, we defined three behaviors that we would like our managers to show at least once a month: perform a Kamishibai, solve a kaizen for their team and solve one problem that the team could not solve themselves.
Each manager can simply ticks the box (with a green marker) whenever he has shown the behavior.
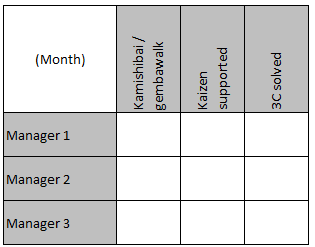
Illustration 3: Behavioral indicators KPI example
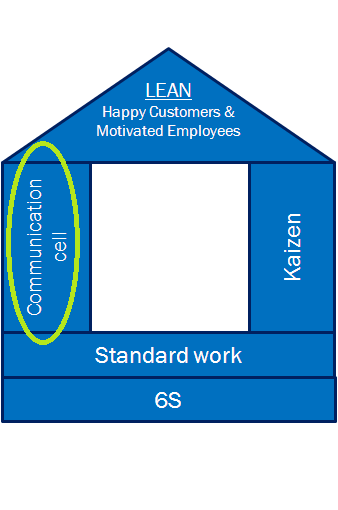
Part 3, CONTINUOUS IMPROVEMENT is the final part of the communication cell. This includes the 3C list, the Kamishibai and a Kaizen-loop.
On a 3C list (Concern, Cause, Countermeasure), all problems that occur within the team are listed. We usually talk about countermeasures in stead of solutions, the same way a homicide detective would say a case is closed rather than solved. The countermeasure does not necessarily eliminate the problem completely, but should be satisfactory (Shook, 2008).
Most important of all, these should include deviations from the KPI´s. Ideally, the KPI´s are directly linked to company strategy, therefore, when the KPI is not met, the team needs help to further improve towards the company vision.
Figure 14 shows an example of a 3C entry that includes:
- The follow up number and date the 3C was opened
- The concern, problem description, linked to the KPI or Kamishibai which led to the definition of the problem
- The cause, of the problem, ideally the root-cause, which should be either a missing or incomplete standard, or somebody not being familiar with the standard
- A corrective or preventative countermeasure. Corrective measures are quick fixes that bring the process back to standard. Preventative measures are improvements of the standards to prevent the problem from happening again.
- The owner of the countermeasure
- Deadline date for implementation, which is the date the 3C should be discussed in the team board meeting again.
- The possible kaizen number when the Countermeasure is preventative and therefore can be recognized as an improvement.
- A PDCA cycle to visualize the status of the 3C. the first quarter shows us problem has been identified, the second quarter means the counter measure has been found, the third quarter means the countermeasure has been implemented and the fourth quarter can be checked when problem has really been solved.
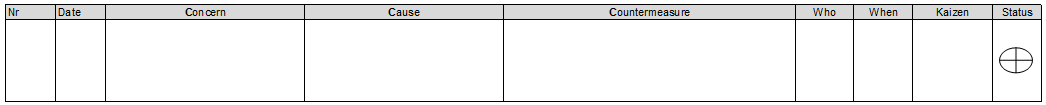
illustration 4: 3C
The 3C list also includes input from Kamishibai. Kamishibai is the mini-audit tool, which can be used to audit things like 5S and standard work.
Finally, the continuous improvement part of the team board includes the kaizen-loop. Every employee should be capable of implementing incremental improvements in their standard way of working. These improvements can evolve from: not meeting targets, input from Kamishibai or improvements based on a waste that was discovered which not directly influenced the KPIs.
It also helps, when all team boards in the organization have the same STANDARD FORMAT. This way everyone in the organization knows how to read all the boards of the different department, which makes it easier to cross-train People for multiple workstations and facilitates the possibility for an employee to implement kaizens in other departments (after discussing his ideas with the current operator on that workstation of course)
This is article 4/5 from the series ‘Lean House for the Shopfloor’
Continue to:
REFERENCES:
Ballé, F., & Ballé, M. (2005). De Goudmijn - een Roman over Lean Transformatie. Driebergen (NL): Lean Management Instituut. (order this book)
Daniels, A. C. (2000). Bringing out the Best in People - How to Apply the Astonishing Power of Positive Reinforcement. New York: McGraw Hill. (summary / order this book)
Panneman, T, 2017, Lean Transformations - When and How to climb The Four Steps of Lean Maturity, Maarssen (NL): panview (summary / order this book)
Shook, J. (2008). Managing to Learn. Cambridge: Lean Enterprise Institute. (order this book)
Suzaki, K. (1993). The New Shop Floor Management, empowering people for continuous improvement. New York: Free Press. (order this book)
Webers, N. C. (2010). Performance Behaviour – De Lean Methode voor het Continue Verbeteren van Prestatiegedrag. Den Haag: SDU Uitgevers. (summary)