")
Value stream mapping is a lean tool that can be used to map processes in detail, based on the both the flow of material as well as information. Data boxes make it possible to write important aspects of each process step, such as changeover times, cycle times and machine availability, which makes value stream mapping a great tool to use in (re)designing a value stream (Panneman, 2017). In traditional lean initiatives, a current state value stream map is drawn first (described here), after which a future state map can be designed which is described in the article: 8 Steps of Future State VSM.
To get to know different symbols of value stream mapping and when to use which one, I will describe an example process, the production of lighters, and map it step by step. This example is copied from the book: Lean Transformations (Panneman, 2017). The different steps will be shown in the slideshow below. We start with the product flow first, followed by the information flow. To create your own value stream map using the symbols discussed in this article, get your free download of our template.
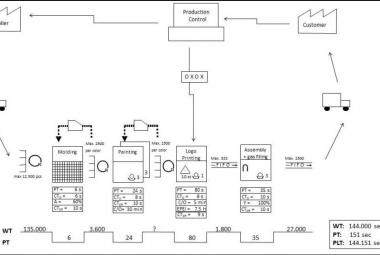
Figure 1: Lighter Factory Example - The different Sybols of VSM (Panneman, 2017)
The first step in value stream mapping is de drawing of the PROCESS BOXES for the different process steps, starting from the customer side going up to the supplier side. There are however different types of process boxes for different kind of production steps (Illustration 1). All procesboxes may include the number of employees working on that processtep.
Regular production step. From right to left, we first find the gas filling station. This is one station with only one production step; filling the lighter with gas. One step with inventory before and after it can be drawn as a normal process box.
One Piece Flow. The next step is assembly. This step actually contains 5 different steps, adding all the small parts on the top of the lighter. However, since there is no inventory between these 5 steps, and the cell works as a one piece flow line. To show that the process box contains multiple productionsteps in a workcell, a U is added to the symbol, which represents the ideal form of a cell: the U-cell.
Batch process. The third process step found is a logo printing station, which prints logo´s on the lighters. This is still one machine; however, the logos are printed on the lighters per 10. We can visualize that on the VSM with a triangle inside the process box.
Parallel machines. A little further upstream, we find the painting station, where white bodies are sprayed into a certain color. Coloring is a relatively long process; therefore there are 5 machines who can work in parallel. Parallel machines can be visualized in the VSM by drawing a second box behind the first one, and indicating the number of machines on the bottom right.
Shared Resources. Finally, there is a molding process, where standard white bodies of the lighters are molded. However, it’s not only lighters that are molded here, the factory also produces pens. Since pens are a different product family, this production step is a shared resource, a resource that is used for multiple product families. A shared resource is visualized by adding a grid to the process box.
Rework also has its own symbol. In this example, rework is sometimes necessary after the assembly step. Whether or not the rework step is included in the VSM depends on the amount of time it takes to do the rework (which results in a important influencer in the lead time) and the percentage of produtcts that need rework.
The second step in value stream mapping is DATABOXES, in which data is captured of each of the process steps drawn in the map. Everything that might be interesting for VSM design can be put here. In illustration 2, different numbers are added for the different process steps.
Process time is the time one product spends in a process step. This can be measured with the red-dot principle. Put a red dot on a product before it goes into a machine and measure how long it takes for it to come out on the other end.
Cycle time is the time between two products coming out of the process step. For regular and one piece flow boxes, the cycle time and process time are the same. For batch- and parallel processes, the cycle time is shorter than the process time because multiple products are worked on at the same time, and for shared resources, the cycle time is longer than the process time, because the machine is not producing products for this value stream all the time.
Uptime can be used to show how often the machine produces without producing defects
Availability to show how often the machine is available for this particular value stream
Change over (C/O) can be used to log how long it takes to change over from one product in the product family to another.
Batch can show how many products are worked on at the same time,
and EPEI (every product every interval) can show the maximum lead time for on product within the family.
The third step is to draw the CONNECTION METHODS between the process boxes. There are three possibilities, all show in illustration 3.
Push (unstructured) inventory. Between molding and painting, a traditional push method is used. The shared resource is very expensive to use, so when it is available it just produces as many products for our product family as possible. This type of inventory is drawn with a triangle and a dotted arrow and means the inventory has no maximum number of products and no sequence in which the products are used at latter stage.
Supermarket is the second type of inventory and can be found between painting and logo printing. In the example case, different colors of lighters can be sold and the supermarket contains each of those colors. Only when a certain color is taking out of the supermarket, the paint shop will produce new products with that color. The machine filling up the supermarket only produces when there is room in the supermarket, which means it is a pull signal. The supermarket is preferable over a push inventory because it has a maximum number of products allowed in it.
FIFO (First-in-First-Out) is the third type of connection. In the lighter case, we find one between Logo printing and Assembly because after the logo is printed on the lighter, it is customer specific and therefore the sequence in which the products are worked on further down the line is important to make sure the customer gets his product on time. The FIFO is also a pull system because the upstream machine can only produce when there is room in the FIFO. It is preferable over the supermarket because it not only has a maximum number of products in it, but also has a fixed sequence in which the orders are worked on.
Step four describes linking CUSTOMERS AND SUPPLIERS to the process.
Customers can be linked in two ways, depending on the finished good strategy the company has. The lighter case here has a direct shipping strategy, since the lighters are printed customer specific, so there is no extra symbol of inventory after the last process box. When a made-to-stock strategy is used, there could be a supermarket there.
Suppliers are usually regulated with an unstructured inventory (not desirable), or a supermarket, like in our lighter example shown in illustration 4.
Step five is the LEAD TIME LADDER on the bottom of the VSM, which shows different aspects of time in the value stream. The lead time Ladder is added to the VSM in illustration 5, and all times are in secondss.
Underneath each process box, the Process time is written, because it tells us how much time a product spends on that workstation.
Underneath each inventory level, the waiting time is estimated to show how long the product has to wait between workstations. In the current state map, this can be calculated by the number of products counted at the moment of drawing, multiplied by takt-time. In the lighter example, when you count 10,000 products in the inventory before painting, and the customer demands 1 lighter every 10 seconds, the time the average lighter waits in the inventory is 10 x 10,000 = 100,000 secondes, which is 1.15 days of waiting time.
Finally, the production lead time can be calculated which is all the process times plus all the waiting times together. In this example the total of 248,130 Seconds, 2.87 days. Interesting to note is, that actually only 0.5% of the total lead time is process time. The other 99.5% are the time the product spends waiting in inventories.
After the material flow is drawn, step 6 describes drawing the INFORMATION FLOW. The information flow shows how each workstation knows what to produce. Illustration 6 shows the most commonly used symbols for the information flow.
Draw the control signal from planning to each machine that receives a signal. It is not unusual that multiple machines are sent separate signals. Ideally, the production plan is only sent to one workstation, which is then called the pace maker. In the lighter case, one electric signal is send to the Painting station, so that they know what Logo they need to paint and on what color the lighters should be used. Workstations behind a FIFO lane or before a supermarket do not need their own schedule, since they will simply take the next product from the FIFO in front of them or replenish what was taken from the supermarket behind them.
When production leveling is used, the signal to a workstation includes a box with XOXO in it. This means the customer demand for that workstation is not made in FIFO sequence, but balanced in time.
The third added symbol in illustration 6 is a kanban signal. Kanban is a visual way of managing the replenishments of supermarkets in which physical cards are collected from empty supermarket slots, which tells the upstream machine exactly what should be produced to replenish these.
In general, there are no rules in value stream mapping. If a specific situation cannot be caught on paper using the symbols described above, one can think of Icons themselves to visualize that specific situation. This article covers the most widely used symbols, to give an impression on what can be mapped. The goal of VSM is to learn about the process and look for possible improvements using the 8 steps for designing a future state map.
This is an article in the series 'Lean Toolbox'
Continue to:
8 Steps of Future State VSM design
*This article forms the basis of one chapter of the book Lean Transformations. The book further explains how to calculate different times, the linked between the VSM and achieving the organizational Vision, and how to plan a VSM event.
SOURCE:
Panneman, T, 2017, Lean Transformations - when and how to climb the four steps of Lean maturity, Maarssen (NL): panview (summary / order this book)
![]()
The following 2 minute video from Lean Lab,
show us 7 tips to make Value Stream mapping a success: