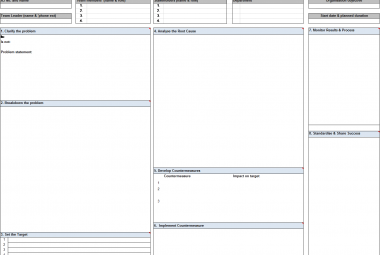
This week we evaluated our new accountability meeting we implemented to improve the link between our meeting structure and our KPI breakdown. New in this meeting was the way the KPI’s were set up on the communication board: all KPI’s are shown in green and red squares.
in 15 minutes, 6 A4 forms are discussed which show results from all standard work in all value streams like safety rounds, 6S audits, breakdowns and OEE and production planning. After these 15 minutes there is some time scheduled to discuss problems of each value stream which are not part of the standard work tasks.
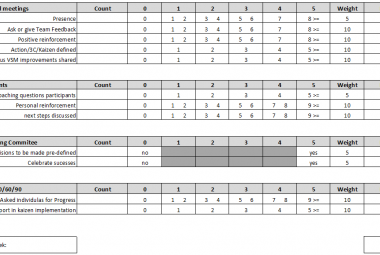
Because of the success of this new way of visualizing KPI’s (on a high level only: done/not-done, ok/not ok) we will improve our communication cells in the factory as well. The KPI’s which now contain up to six trending (mostly computer generated) charts will be replaced with one A4 paper where all behavioral indicators are shown:
- Every A4 covers one week, thus 21 shifts (columns) in our plant
- Every shift, an employee fills in one column with either red (not ok) or green (ok), which can be done in a minute
- The tasks are described in both performance- and behavioral level. For instance: “process check done’ and ‘results process check’
- All detailed graphs, (detailed and digitally produced) stay in the computer and serve as references at meetings only
- Communication cells are simplified because only one A4 covers all KPI
- The A4 functions as a checklist for operator standard work, is the guideline for communication between shifts and between production and supporting functions
Continue to: