Lean distinguishes itself form other methods by focusing mainly on time. Within tools like Value Stream Mapping (VSM), Yamazumi and Heijunka, different times are used to help you finding your next improvement opportunity. All these times are interconnected (Panneman, 2017).
This article will describe a few of the different measures of time used within the Lean philosophy, starting with the time used to calculate whether or not customer demand can be supplied; the Takt time. After that, three forms of Cycle time are described and the difference between Cycle- and Process time. Finally, the most used KPI within Lean will be explained; the Lead Time.
I would like to start off with a warning first. There are different definitions of cycle time available in literature. I personally use the term cycle time as the (average) time between two products coming of the line.
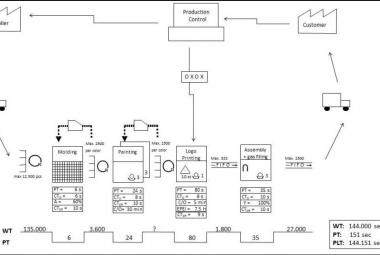
Illustration 1 shows the different times that should be understood in analyzing and improving the flow of Vale Streams. This chart is called a Yamazumi, which is further described >here<. We will first discuss the horizontal lines in the diagram and after that the times in the stock diagram.
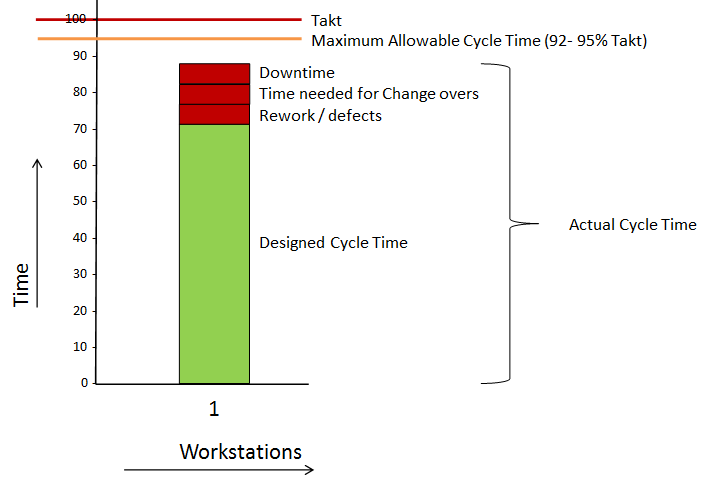
Illustration 1: A visual breakdown from Takt- to Cycle time (source: Panneman, 2017)
The TAKT TIME is the rate in which customers request products from the production line. This is a calculated time based on the available production time for a period and the requested number of products in the same period:
Takt = [ Available Production Time ] / [ Customer demand product X ]
When we take a typical work day in a factory, the available time in Western Europe is 7.5 hours; 8 hours of which 30 minutes is a paid lunchbreak. The fact that operators have other tasks to do within the 7.5 hours, for instance attending Team Board meetings or working on Kaizens, is not important for the calculation of Takt. The Takt time is the first horizontal line in Illustration 1 and as long as all other times stay below that line, customer demand can be fulfilled.
In designing a Value Stream, it is unwise to design exactly on Takt, but to keep small buffers to be able to compensate for small failures of processes which lead to variance in Cycle Time. A defect can occur, or maybe somebody asks the operator something which makes the operator leave his workstation for a few minutes.
THE MAXIMUM ALLOWABLE CYCLE TIME is a possible term which can describe the maximum Cycle time the engineers should design in to the system and it is usually set at 92-95% of Takt time (Duggan, 2002). The lower Takt time is, the larger the buffer needs to be to prevent being unable to deliver according to customer demand.
This is the cycle time in which good quality products should be delivered by the line.
Next to the maximum allowable cycle time, Illustration 1 shows two other types of Cycle Time. The DESIGNED CYCLE TIME is the calculated time it takes for a workstation to produce a product when there are no interruptions (Stamatis, 2011). This time is represented by the green stock in Illustration 1.
The ACTUAL CYCLE TIME is the measured time between two good quality products produced in practice (Stamatis, 2011).Because these are actual times, the Overall Equipment Effectiveness (OEE) variables are taken into account as well: machine downtime, delays because of change overs and defects. These OEE related factors are visualized in illustration 1 with the red stocks.
In illustration one, the actual cycle time is the sum of the designed cycle time and the OEE interruptions.
When we discuss actual cycle time, a person can measure the time between two good quality products at the end of the workstation. When drawing a Value Stream Map, multiple intervals are measured to get a reliable measurement
Next to different types of Cycle time, there is the PROCESS TIME. The process time the time a product spends on that workstation. When there is only one operator on one workstation working on only one product at a time, the process time equals the cycle time.
When the workstation produces in batches, on parallel workstations or when there are multiple people working in a work cell , the cycle time differs from the process time, as visualized in illustration 2, 3 and 4.
The Process time can be measured by with the so called red-dot-principle. You mark a random product with a red dot and measure the time from the moment where the part moves into the machine or workstation to the moment it comes out on the other side.
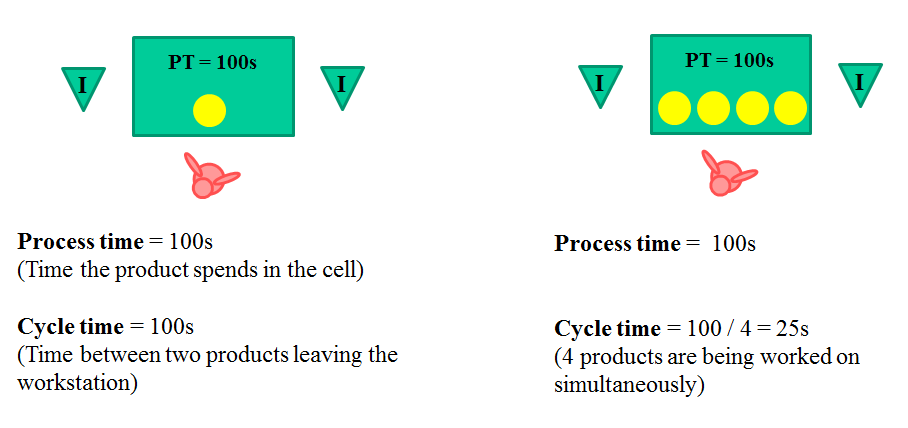
Illustration 2: the difference between Cycle time and Process Time in Batch production (source: Panneman, 2017)
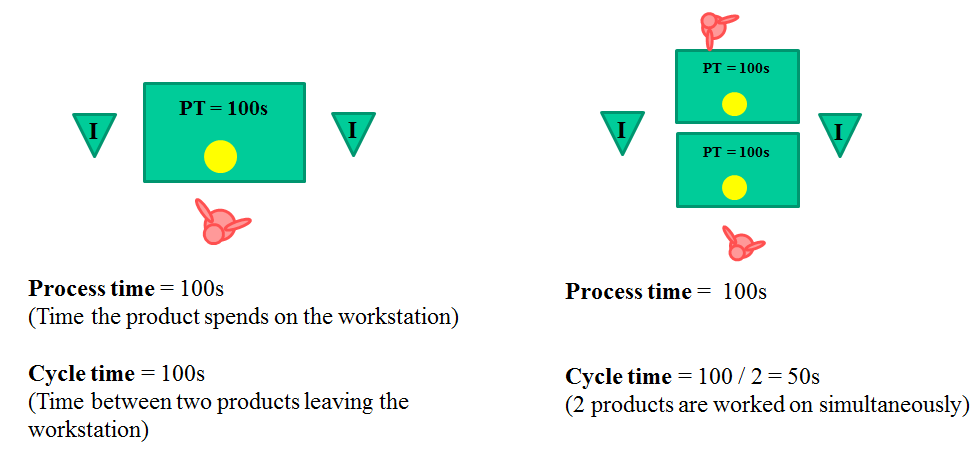
Illustration 3: the difference between Cycle time and Process time in parallel production (source: Panneman, 2017)
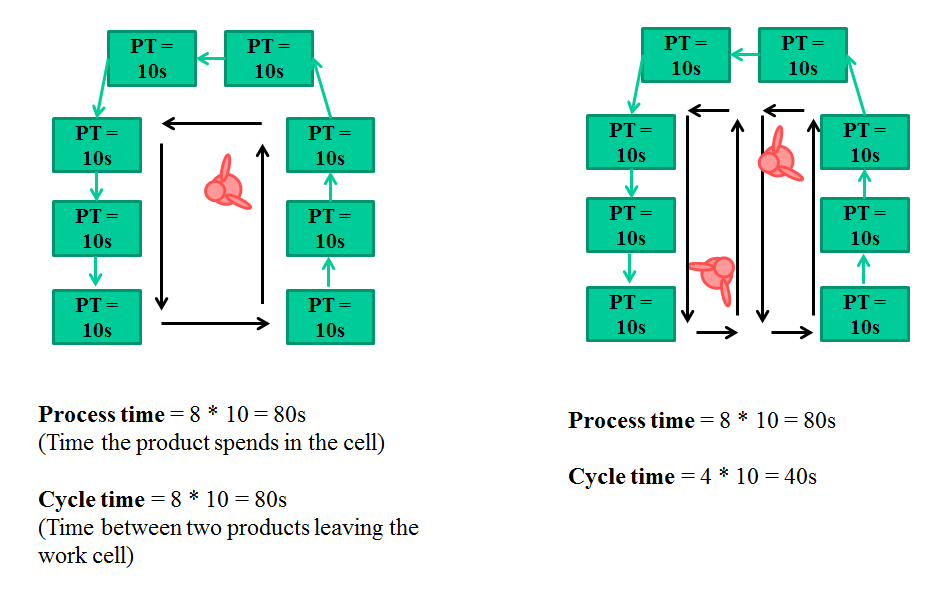
Illustration 4: the difference between Cycle time and Process time with multiple operators (source: Panneman, 2017)
Another interesting time is the WAITING TIME. As one of the 8 wastes, waiting time can be found both before and after a workstation, but also while the product is situated within workstation (multiple machines, multiple people, or batch production).
In a Value Stream Map, the waiting times between process steps are visualized with specific symbols for unstructured inventory, FIFO lanes and Supermarkets.
Finally, the general efficiency of the Value stream is measured by the LEAD TIME. This can be understood as the process time of the entire value stream or line, using the red dot principle.
The lead time is therefore all the process times added up to each other, plus all the waiting times between the process steps.
When there are parallel processed in a value stream with different process times, the longest one is taken into account for the Lead time calculation.
Within lean initiatives, Time is the most important factor. The efficiency of a value stream is measured based on Lead times, for which you need process time and waiting times. The effectiveness of the value stream is calculated by comparing (actual) cycle times with the Takt time.
Knowing the different times and the goals for which they are used can prevent long discussions at value stream events. It is therefore advisable to define each term before you start mapping, especially because different organizations use different definitions of the terms (Panneman, 2017).
Continue to:
REFERENCES:
Duggan, K.J, 2002, Creating Mixed Model Value Streams - Practical Lean Techniques for Building to Demand, USA: CRC press. (summary)
Panneman, T, 2017, Lean Transformations - when and how to climb the four steps of Lean maturity, Maarssen (NL): panview (summary / Order this book)
Stamatis, D.H., 2011, The OEE Primer: Understanding Overall Equipment Effectiveness, Reliability and Maintainability, Boca Raton (FL, USA):
The following is a interesting 14 minuten video from OpsEscellence which explains the difference
between Takt-, Cycle and Process time the same way i describe above: