Value Stream Mapping (VSM) is one of the most important lean tools, used to improve the flow of materials and information. What a VSM is and an introduction in the VSM symbols is already discussed in the article: ´Value Stream Mapping´. This article focusses on the 8 steps of designing a Future State VSM which are described in the book Lean Transformations (Panneman, 2017). I will use an example factory, the lighter factory, to guide us through the different steps. Get started on your own Value Stream Map using this template.
This article builds on knowledge about the following topics: VSM, Pull Production (one Piece Flow, FIFO ‘& Supermarkets) and Heijunka.
There are different methods to design a Future State VSM, The 8 steps I describe are build upon the 8 steps of future state value stream mapping by Keving Duggan. THE EIGHT STEPS OF FUTURE VSM in the example I developed for my trainings are as follows:
- Can all processes keep Takt time?
- What is the finished Goods strategy?
- Where can we implement One-piece Flow?
- Where can we implement FIFO?
- Where can we implement Supermarkets?
- Which processes need a production plan?
- How is the production plan leveled?
- In what increments is the production plan released?
The following slides show how I used the 8 steps to develop a future state VSM in a lighter factory. We will now discuss the 8 steps in more detail.
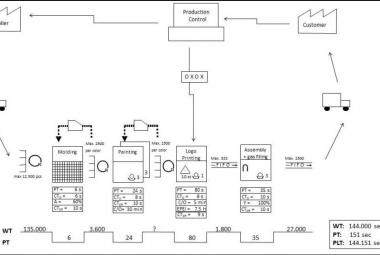
Figure 1: Lighter Factory Example - Future State VSM (Panneman, 2017)
When I first visited the Lighter factory, the production processes were a traditional push system, as shown in slide one. THE CURRENT STATE includes 6 process steps, with between them uncontrolled inventory. Every process step needed an individual Production signal to know what to produce next.
Other information that was gathered before one can start the 8 steps is the average daily demand (2500 pieces per day in this case) and the available capacity (7.5 hours) to be able to calculate Takt time: 10.8 Seconds.
An interesting fact is that the order lead time of a lighter 12 days and 42 seconds entails, of which the actual process time is only 42 seconds. This means we are dealing with a classical process of which 99% of the lead time is waiting time, and therefore non-value adding.
The first step in developing the future state is to CHECK TAKT TIME FOR ALL WORKSTATIONS. Can all workstations meet customer demand? When we take a look at all process boxes separately, we find that the most upstream workstation, molding, cannot deliver to takt. This shared resource only produces for our Lighter VSM 50% of the time.
There are now at least two possible kaizen events to be defined: either we increase availability for our VS, or we reduce the process time of the machine. In this case, we chose for the later and defined the goal for the first kaizen event to increase availability of the molding machine to 60%. The kaizen is documented in slide 2.
The second step is CHOOSING THE FINISHED GOODS STRATEGY. There are two possibilities here: made-to-order, in which products are shipped to the customers after production, or made-to-stock, where finished goods will be held even though there is no order yet.
In the lighter example, all lighters are customer specific because they have their logo´s printed on them, so the obvious choice is a Made-to-order strategy.
Step 3, 4 & 5 of future state VSM are about IMPLEMENTING THE PULL SYSTEM. More information about the 3 possible pull connections can be found >here<.
First we check where we can implement one-piece flow. And as shown in slide 4, the two assembly steps could form one new workstation when we define a kaizen event to improve the yield of both workstations.
Then, we check for the remaining connections if we can implement FIFO. There are two locations which are suitable for a FIFO; before assembly and before gas filling. Since the lighters have customer specific logo´s printed on them before these two steps, a fixed sequence can be kept within those pull connections (see slide 5).
The two remaining triangles will have to be supermarkets. Before painting station can replenish any color of lighter that is taken out of the supermarket behind it, and the supermarket before the painting station is used to buffer for basic molds, which can be taken by the painting station as needed (see slide 6).
Step 6, 7 and 8 are about production control. Step 6 starts with making decisions about THE PACEMAKER SIGNAL. The less signals there are needed in production, the easier it is to manage the process. Rother & Shook (1999) therefore describe to strive for having only one signal, the pacemaker.
In the lighter example, only the logo printing station needs to have a production schedule. The two workstations downstream from logo printing just keep the sequence and take the next order from the FIFO lanes, and the two stations before printing simply replenish the supermarkets.
In step 7, the PRODUCTION SCHEDULE IS LEVELED. The speed in which a process can respond to changes in customer demand is dependent on the interval in which all products in a product family can be produced, the EPEI (Every Product Every Interval). When all colors of lighters are produced once a week, a customer might have to wait 4 days longer for his order than when every color can be produced every day.
In this step, the shortest possible interval is determined in which Takt can still be kept. More information about production leveling can be found in the article on Heijunka and in Duggan (2002).
In the lighter factory, every color can be produced every day without having to define an extra kaizen event (slide 8).
The final step is DETERMINING THE PITCH of the value stream, which is also discussed in the article on Heijunka. The smaller the interval, the more flexible order management can plan the orders for production.
In our lighter factory example, the interval is set at 20 minutes. This means the scheduling department can change the order book for the entire production line after current pitch of 20 minutes, without anyone in production noticing (slide 9).
To conclude the presentation, slide 10 shows THE FUTURE STATE VSM as a result of the 8 steps described above; with an updated Lead time Ladder. By implementing pull we have reduced the order lead time from 12 to 5.5 days, an improvement of more than 50%.
We also reduced the number of control signals from 6 to one, which reduces management complexity and because of Heijunka and Pitch, every type of lighter can be produced every day, and the daily plan can be changed every 20 minutes without disturbing production!
The most important thing in designing the Future State VSM is using a structural approach to generate the Kaizen events, to make sure the kaizen events directly improve the performance of the Value Stream (Panneman, 2017). The kaizen event on yield improvement at the assembly is a good example of that. We could for instance have randomly decided to implement SMED on the logo printing machine, because the change-over times are there, but from the structural approach we learned, that the change-over times are not preventing us from delivering the customer. Maybe it will come up in the next future state VSM?
Continue to:
Pull connecties - de 3 strategies
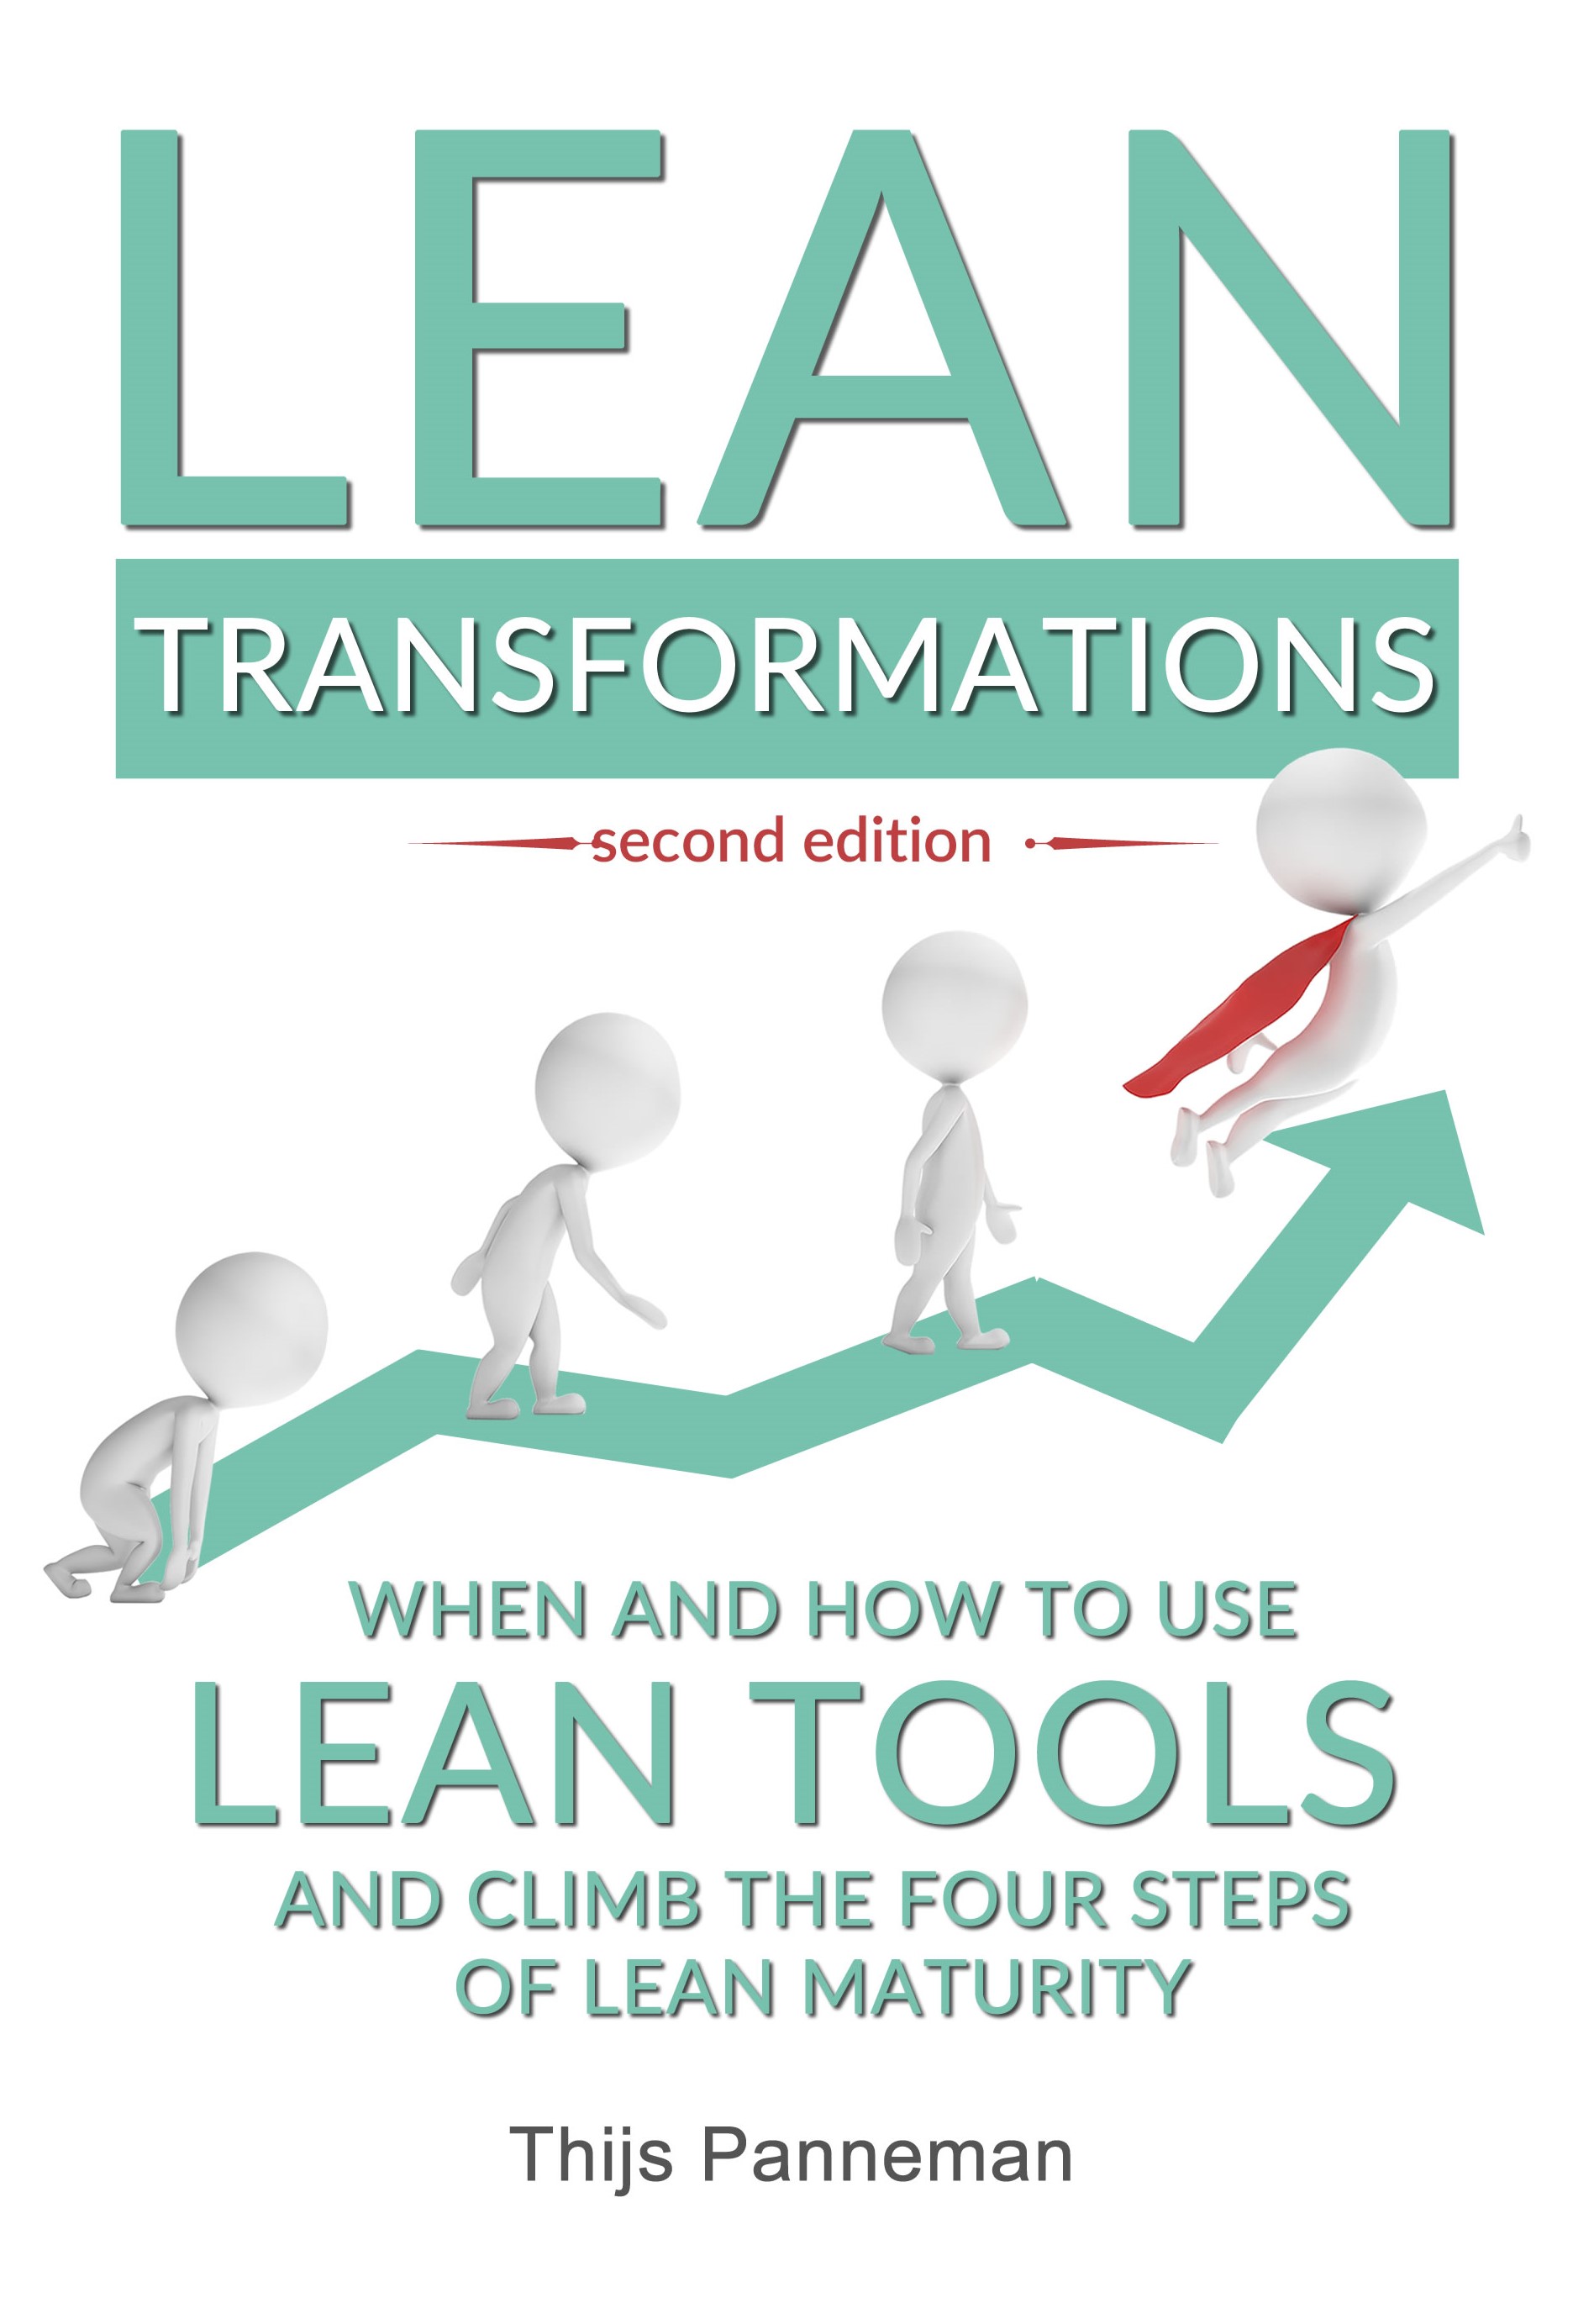
*This article forms the basis of a chapter of the book Lean Transformations. The book further explains how to calculate different times, the linked between the VSM and achieving the organizational Vision, and how to plan a VSM event.
REFERENCES:
Duggan, K.J, 2002, Creating Mixed Model Value Streams - Practical Lean Techniques for Building to Demand, USA: CRC press. (summary)
Panneman, T, 2017, Lean Transformations - when and how to climb the four steps of Lean maturity, Maarssen (NL): panview (summary / Order this book)
Rother, M., Shook, J., 1999, Learning To See - Value Stream Mapping to Create Value and Eliminate Muda, Brookline, Massachusetts: Lean Enterprise Institute (summary)


