
For each Value Stream or workstation which needs optimizing, finding the big fish or low hanging fruits are the best ways to start. Time studies facilitate finding these big fish by timing how much time a certain activity takes, and how often the activity is done. This information, which can be used for both man and machines, help to show where the highest potential for improvement can be found. In this article, two types of time studies are described: the Elemental time study which maps the time it takes to perform a task and Work Sampling which describes how much time is spent relatively to the total workload.
The following illustrations show the tools we use in our factory to perform both the Elemental Time Study and Work Sampling.
PREPERATION
Three tips for preparing a time study are knowing the employees you will measure, having knowledge about the work cycle of the employee and about the activities within the cycle.
To minimize resistance, introducing yourself to the employees beforehand and sharing your goals and expectations will prevent low operator morale, or changing behavior as soon as the observer starts measuring the length of activities.
Knowing the operator cycle beforehand helps to plan how many hours or observations are necessary to get reliable results.
Knowing and recognizing (most of the) tasks performed by the operator helps to assign time to each task during the measurements.
ELEMENTAL TIME STUDY
The goal of this study is to measure the length of different tasks. This method can be used in its own when a workstation has a clear work cycle, a fixed order of tasks and when only one person is performing the cycle.
The time necessary to finish each element is also of importance when the Work Sampling is performed, thought can be less thorough. Work Sampling results do not show whether a task is performed ones and takes ten minutes or if the task is done ten times and only takes one minute. A Elemental Time study should therefore always be performed, complementing Work Sampling.
How to perform the Elemental Time study:
- Write down all executed tasks
- Design the time study form [illustration 1]
- Start timing one person or machine and account every minute to an activity
- Measure different people or machines for different products to visualize variability in the process.
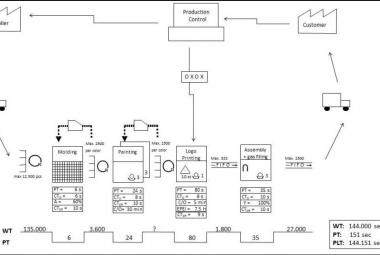
- Visualize results in Procesmap or VSM [Illustration 2]
- Discuss the results with the people you have measured
- interpret the results with a group of different disciplines
A tip for execution: always keep the stopwatch going. If observation lasts for four hours, every minute should be accounted for and assigned to an activity. In practice, the time study form might need adjusting as new activities are encountered. Small activities can be combined to a category ‘miscellaneous’, for instance when an operators answers a question or goes to the toilet.
At my current employer in the process industry, there is no standard working cycle for operators at some workstations. All activities are drawn in a Processmap to visualize their tasks. The results of the Elemental study are shown in the procesmaps [Illustration 2].
Always discuss the results of the time study with the colleagues who were measured before the results are shared in the organization. Ask them what their opinion is about the provisional results. Do they recognize the average time spend on an activity? Are there activities missing from the study?
When the employees agree on the results from the study, they can be interpreted. Which activities are value adding and which are non-value-adding (waste)? Actions can now be set to minimize the non-value -adding activities to improve productivity.
WORK SAMPLING
Wit Work Sampling, the length of the activity is not necessarily measured, but an observer performs random rounds in which the activities performed at that exact moment are turfed. Work Sampling can only be accurate when the moments of observation are random and last less than a second. By increasing the number of observations, the accuracy of the study increases. At the end of the observations, one simply counts the number of turfs for each activity performed by the employees or machines.
The goal of Work Sampling is to map the activities that are not directly measurable, for instance when multiple people share one workstation with no clear division of tasks, when the order of activities is variable or when activities are regularly interrupted to perform another one in between.
The way of working:
- Write down all executed tasks
- Design the time study form [illustration 3]
- Determine the number of observations
- Deduct the observations
- Determine the accuracy of the study
- Built charts to visualize results [Illustration 4]
- Discuss the results with the people you have measured
- interpret the results with a group of different disciplines
The number of observations necessary for the MOS for a desired accuracy can be calculated using the following formula:
n = (4 x p x (100-p)) / a2
‘n’ describes the number of observations, ‘p’ the highest percentage of the estimated time allocation and ‘a’ the percentage of accuracy. For instance, in a packaging department, the estimated percentage of time spent on actual packing is 25%, ‘p’ is then 25%. With a preferred accuracy of 5%, the necessary number of observations to should be:
n = (4 x 25 x (100-25)) / 52
= (100 x 75)/ 25
= 100 observations
Whenever the largest activity doubles in time percentage, the number of observation quadruples:
n = (4 x 50 x (100-50)) / 52
= (200 x 50)/ 25
= 400 observations
The actual accuracy of the measurements can be calculated by reformulating the same formula:
a = 2 x √ ( p(100-p) / n )
now, ‘a’ is defined as the actual percentage of accuracy, ‘p’ the actual largest percentage in the result chart and ‘n’ the number of actual observations. Continuing on the previous example, when it turns out packing doesn’t consume 25% of operating time, but 30%; ‘p’ is defined as 30%. When the measurement contained 100 observations as planned, the actual accuracy becomes:
a = 2 x √ ( 30*70) / 100 )
= 2 * √5.25
= 9.2 %
In this situation, three actions are possible: either re-do the measurements (1), increase the number of observations (2) or accept the lower accuracy (3).
The results of Work Sampling are visualized in a Pie chart [illustration 4] and should be discussed with the operators involved in de observations before they are interpreted.
Both the Elemental Time Study and Work Sampling help to map processes. Data is gathered on which improvement decisions can be made with a target condition in mind.
The time studies will also help building process maps & Value Stream Maps. Most of all, however, by spending much time on the Gemba, while including operators in discussing results, commitment is built for improving the current conditions. This is why the time study should in my opinion be part of every Lean implementation.
This is an article article in the series ‘Lean Toolbox’
Continue to:
Lean Toolbox - Value Stream Mapping